Data processing & QC
Upload, merge, rename, and clean multi-assay datasets. Automated sample ID mapping, technical replicate averaging with SD quality control, and negative-control baseline subtraction.
Luminex · ELISA · Flow · RNAcountEmpowering scientists to uncover what their data is telling them.
SPiDR integrates data analysis from data cleaning to primary analysis to machine-learning–based data mining to pathway analysis, and finally produces publication-ready figures, into a single point-and-click interface — no coding required.
From raw data to publication figures — SPiDR covers the full analytical workflow for immunology, vaccinology, and translational research.
Upload, merge, rename, and clean multi-assay datasets. Automated sample ID mapping, technical replicate averaging with SD quality control, and negative-control baseline subtraction.
Luminex · ELISA · Flow · RNAcountPaired per-subject fold change (post/baseline) for longitudinal designs, or group-mean reference normalization. Automatic timepoint matching and missing-data handling.
Paired subject · By negative-control groupWilcoxon/Mann-Whitney and ANOVA with Tukey HSD across all analytes. Benjamini-Hochberg, Bonferroni, and Holm corrections for multiple comparisons.
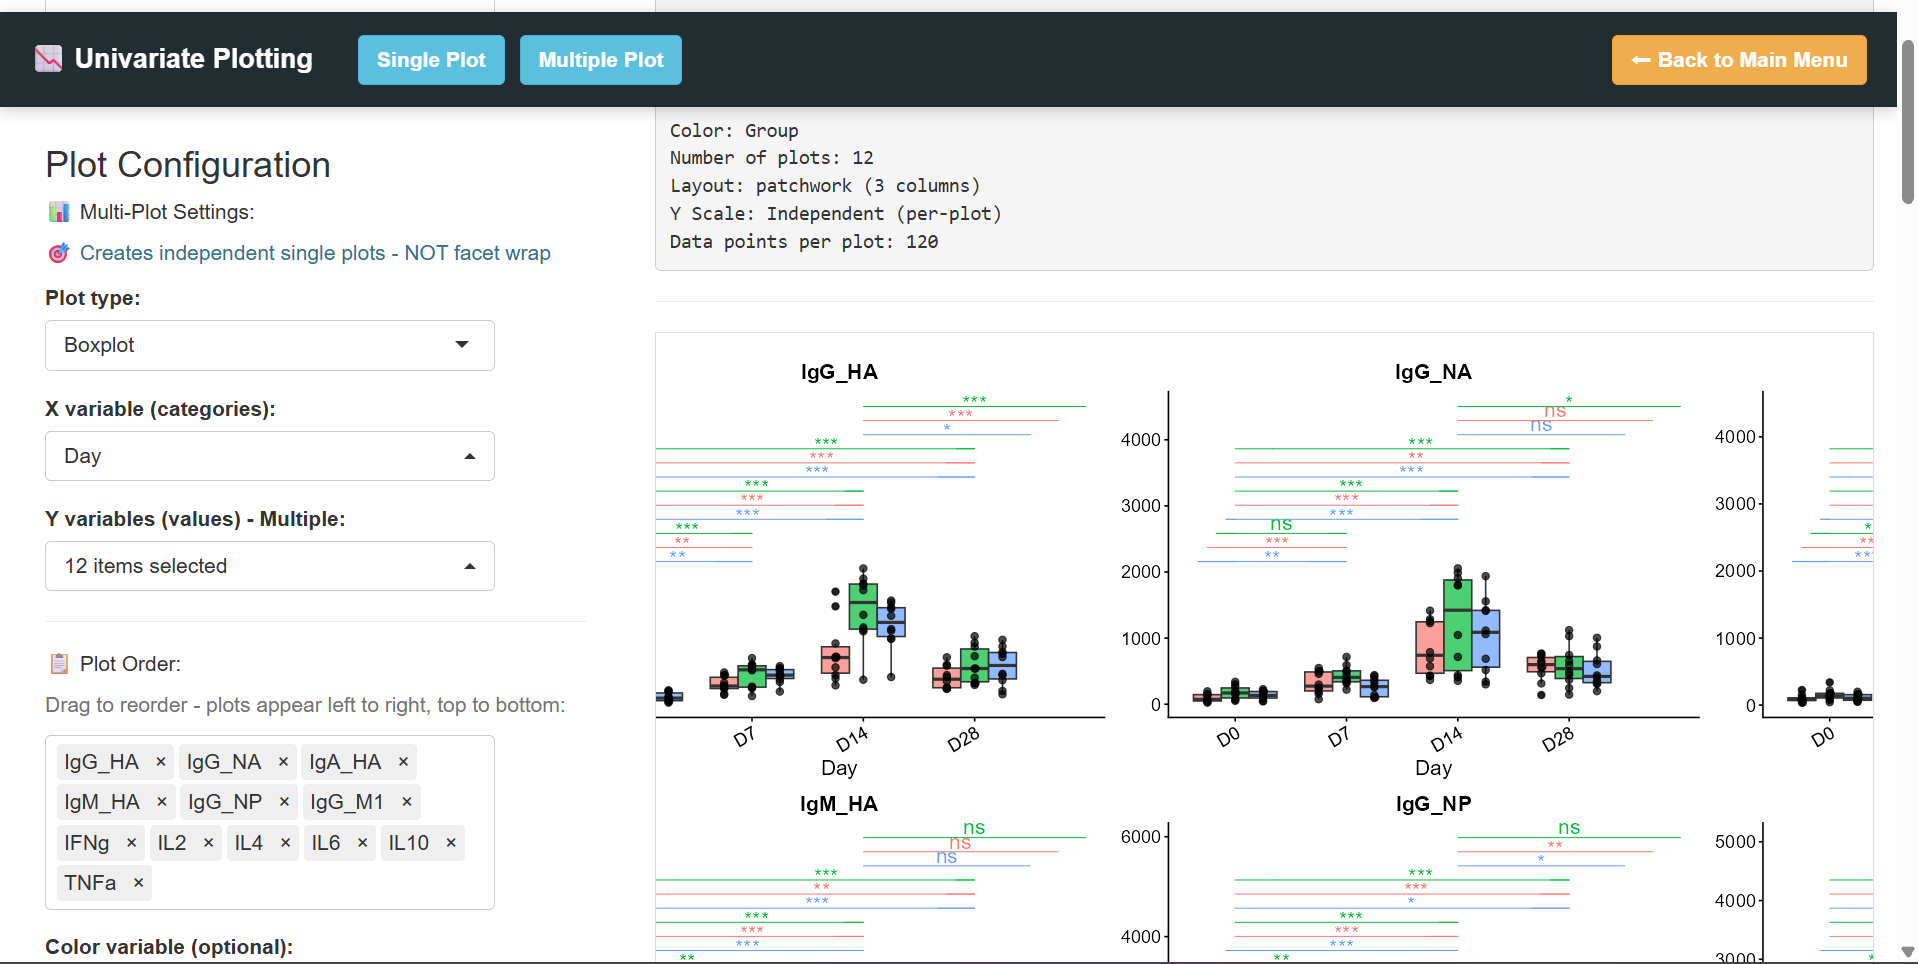
Raw p-value · Conditional p-value adjustmentBox plots, violin plots, and smooth dose-response curves with built-in pairwise significance brackets. Single or multi-panel grid layouts with per-group custom colors.
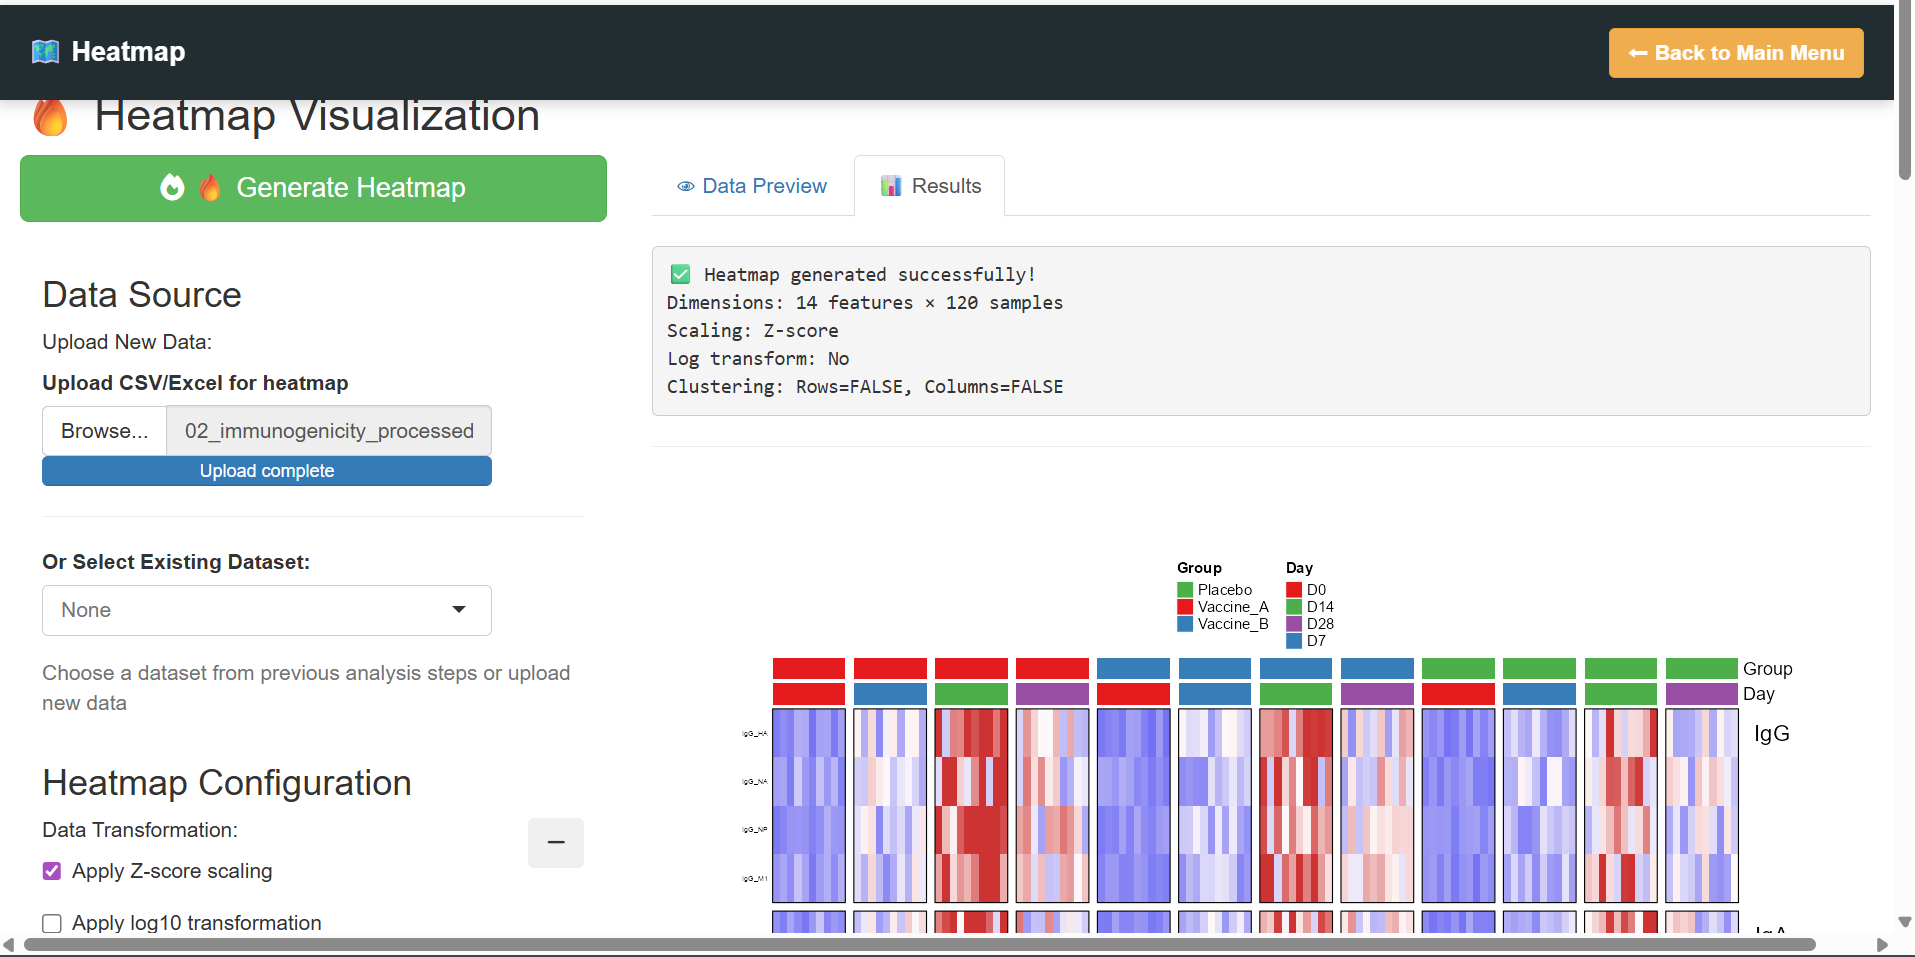
Univariate · Multi-panelPublication-quality heatmaps with Z-score scaling, hierarchical clustering, column splitting by condition, and fully customizable annotation color tracks.
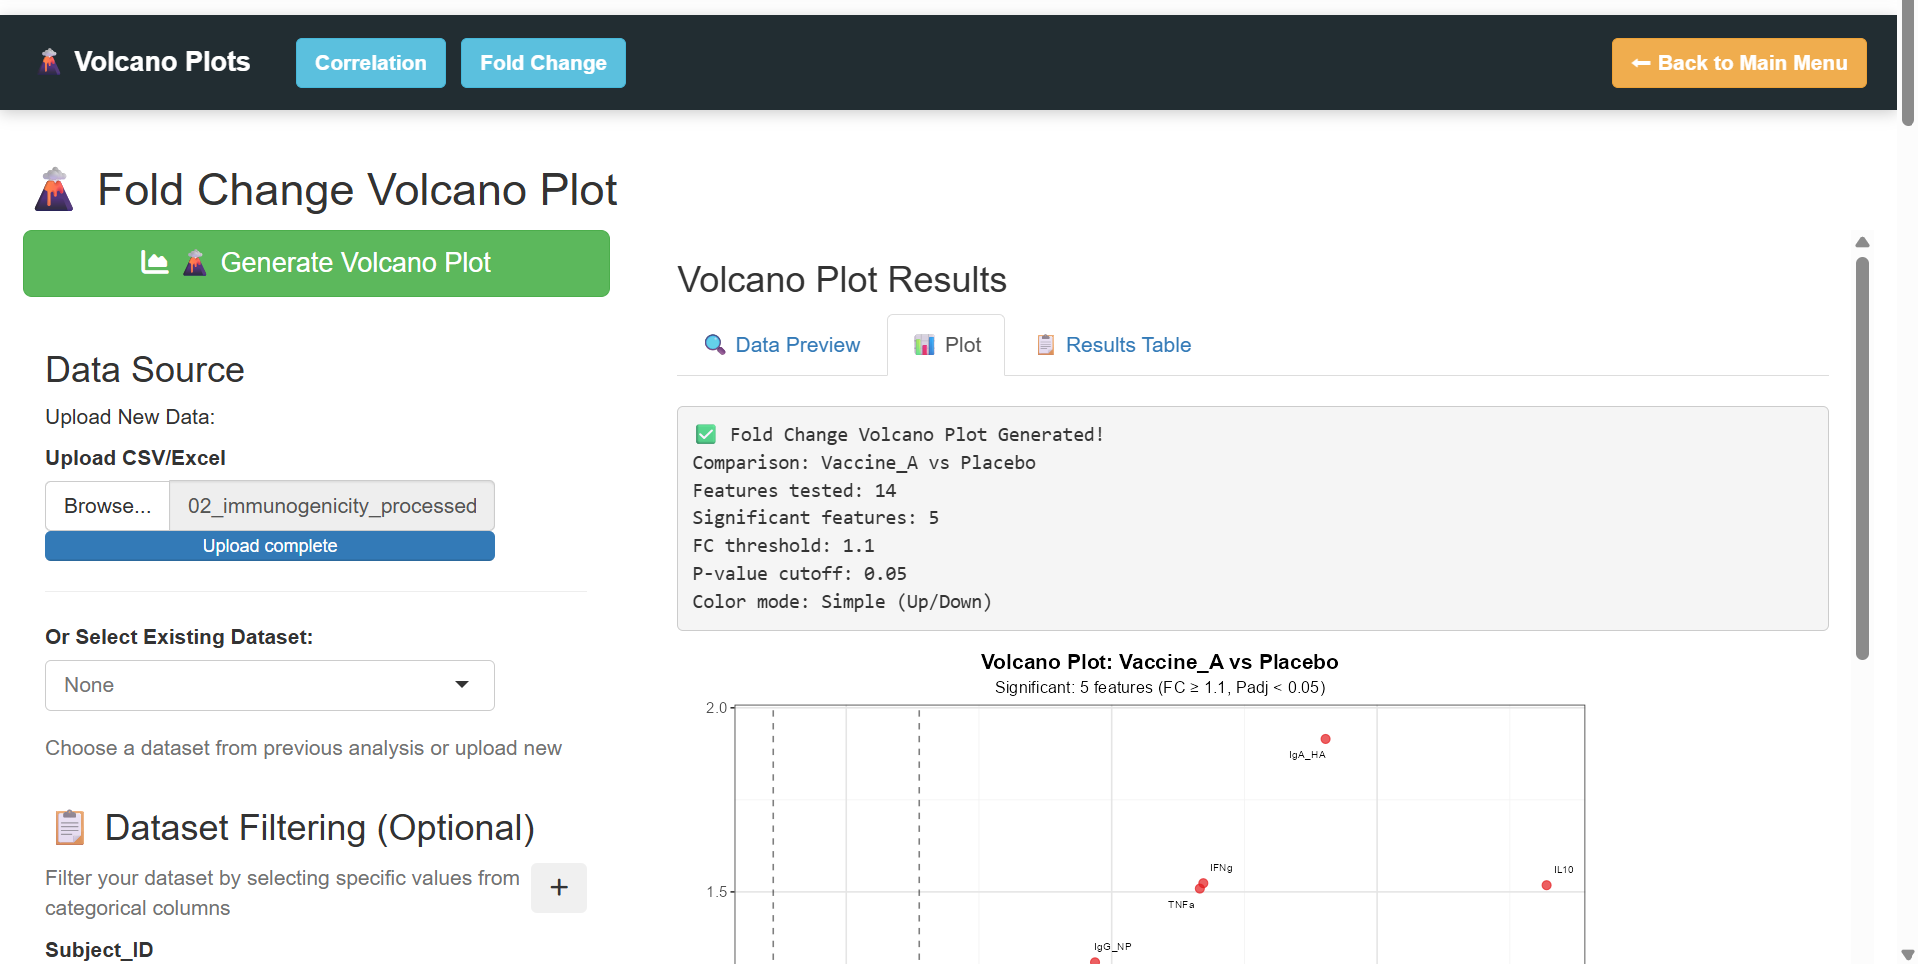
Heatmaps · Z-scoreCorrelation volcano and classic fold-change volcano. Custom category color groups for highlighting analyte classes with publication-ready labeling.
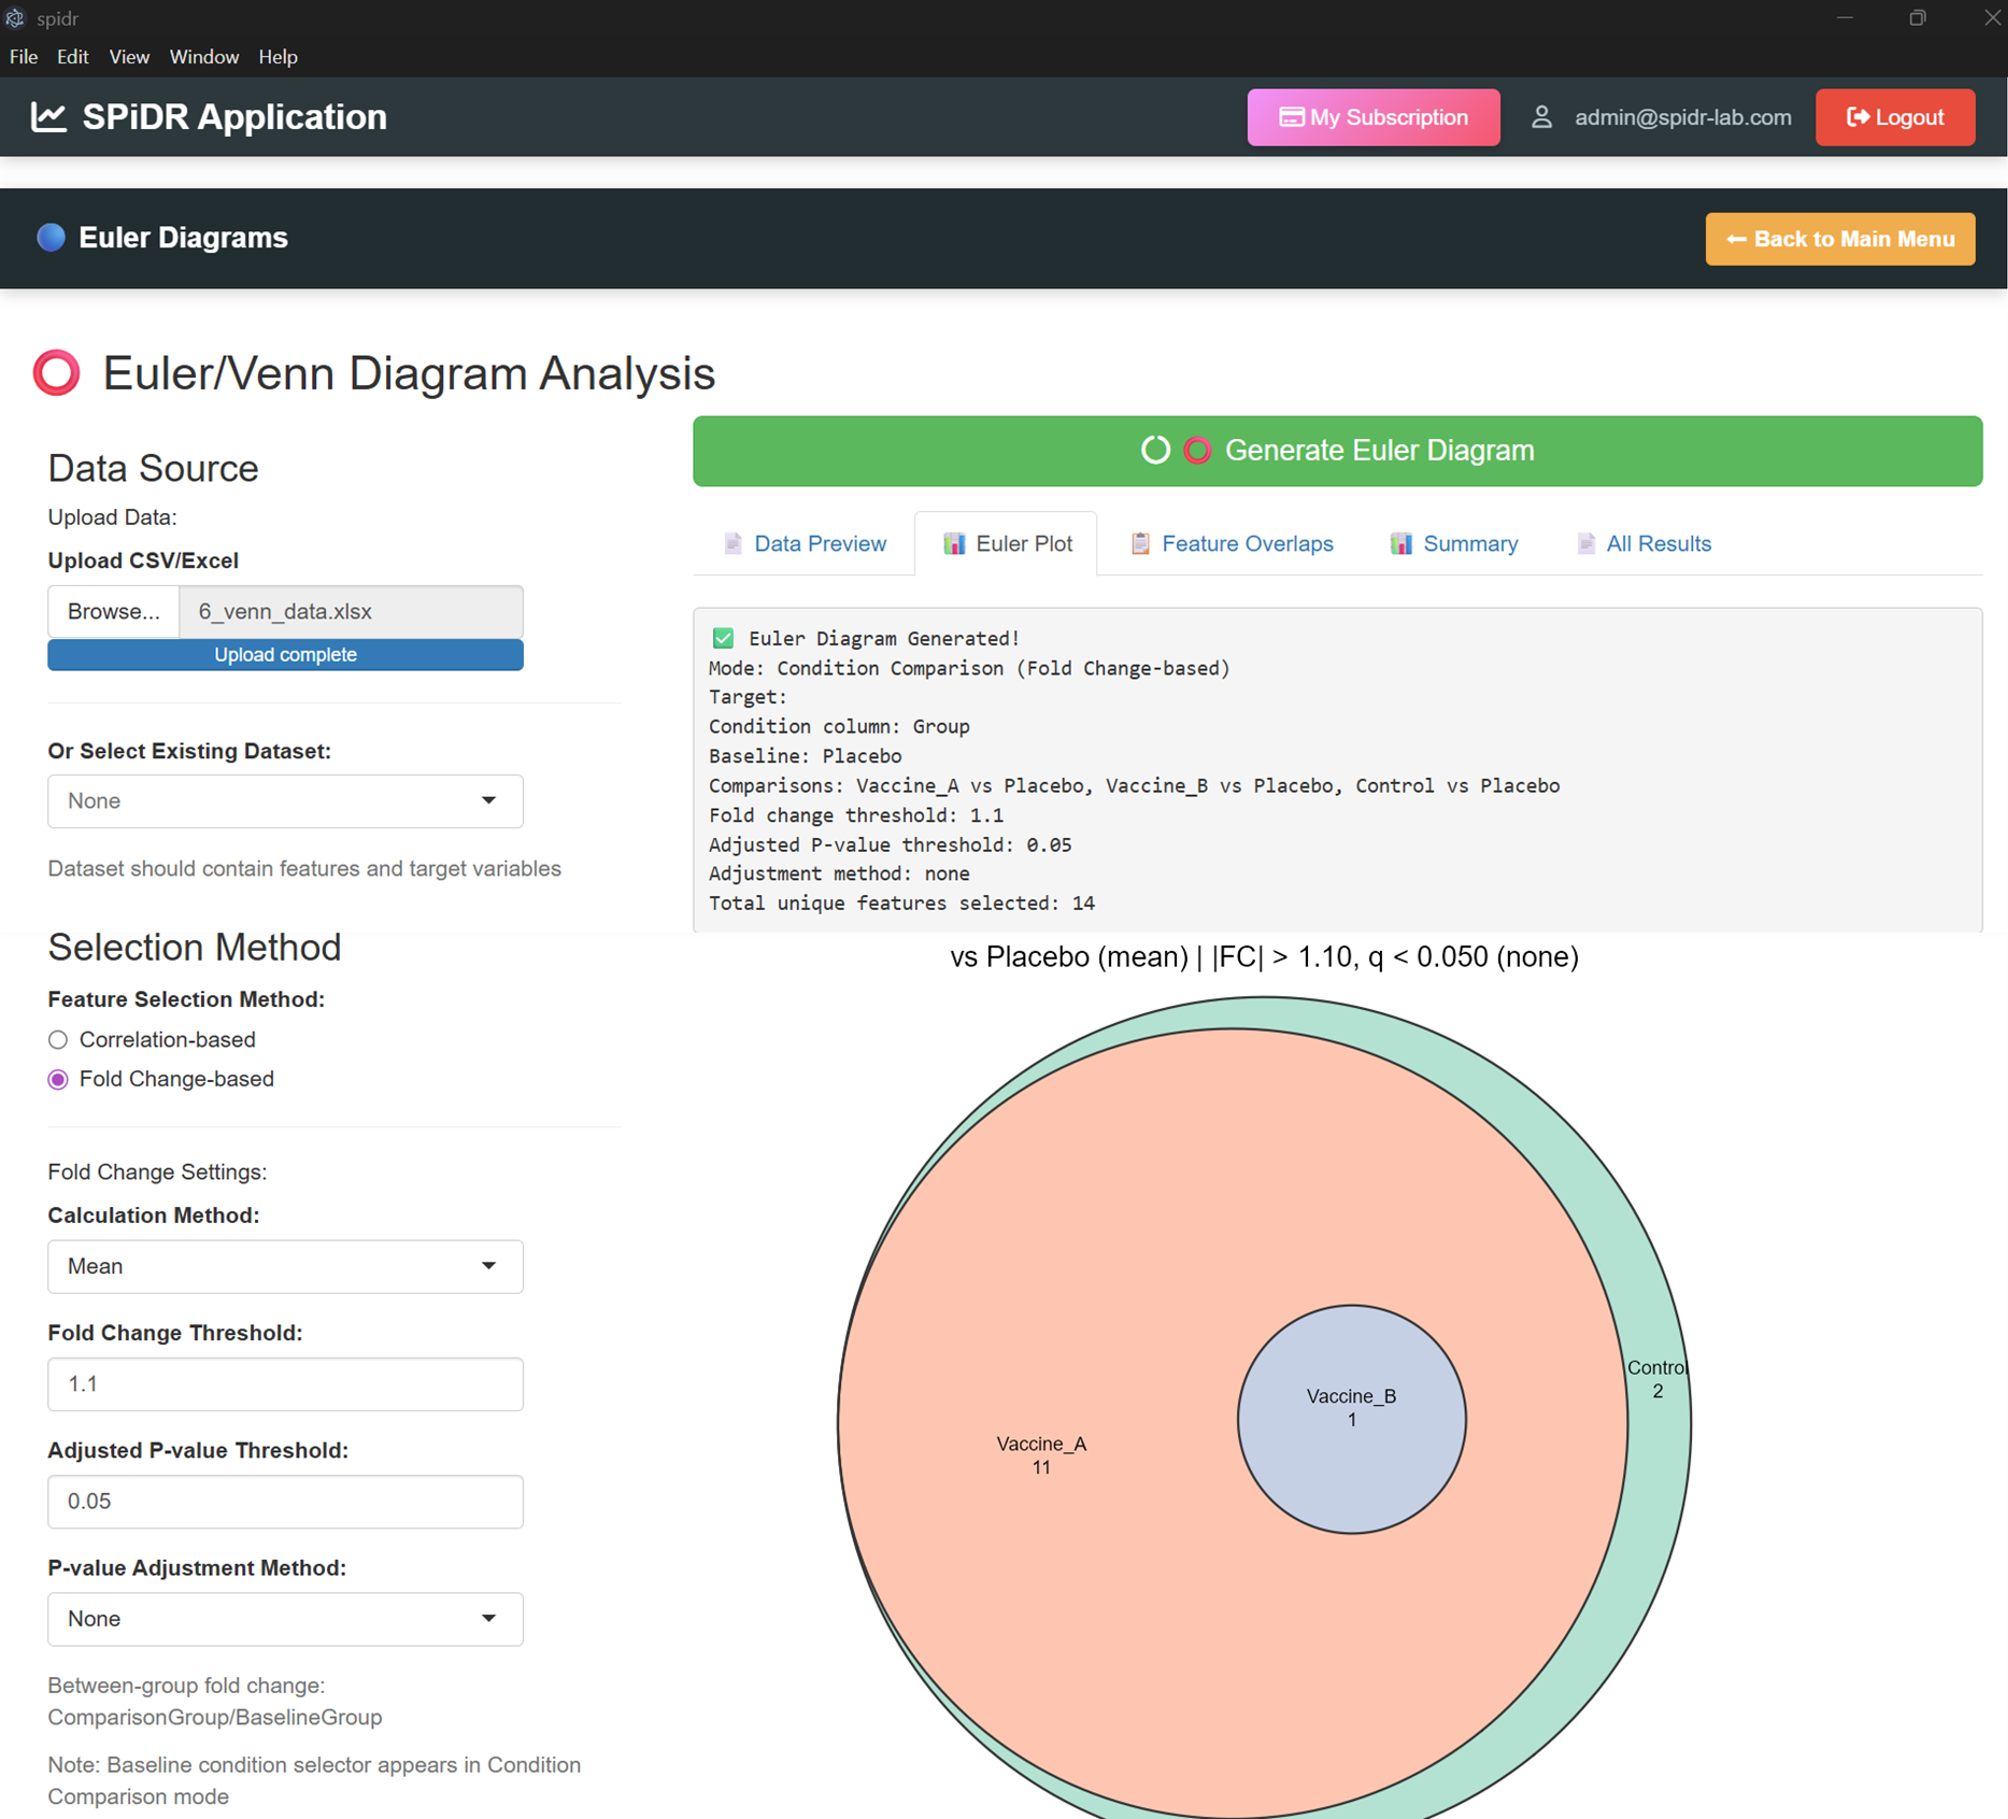
Correlation (Spearman / Pearson / Kendall) · Fold changeArea-proportional overlap diagrams showing which analytes meet significance thresholds across multiple targets or conditions.
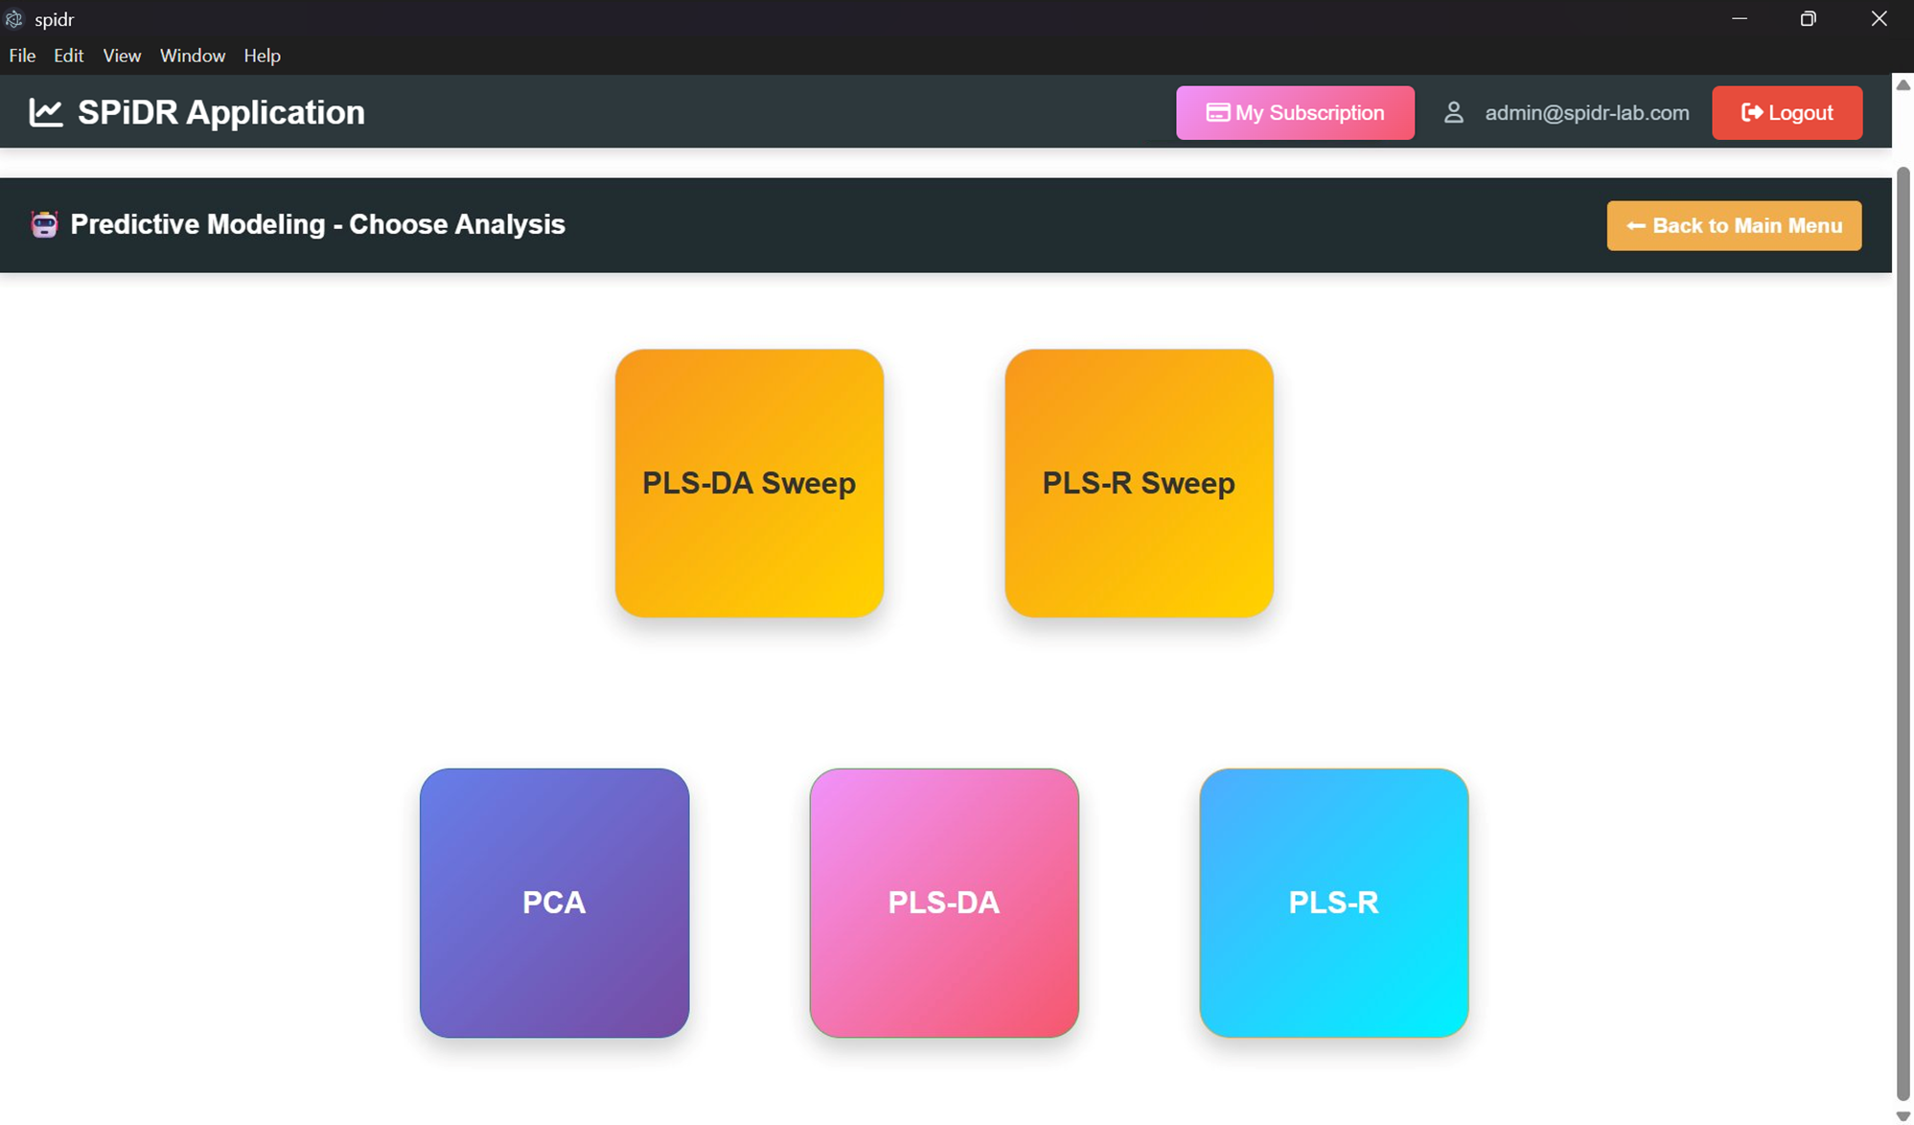
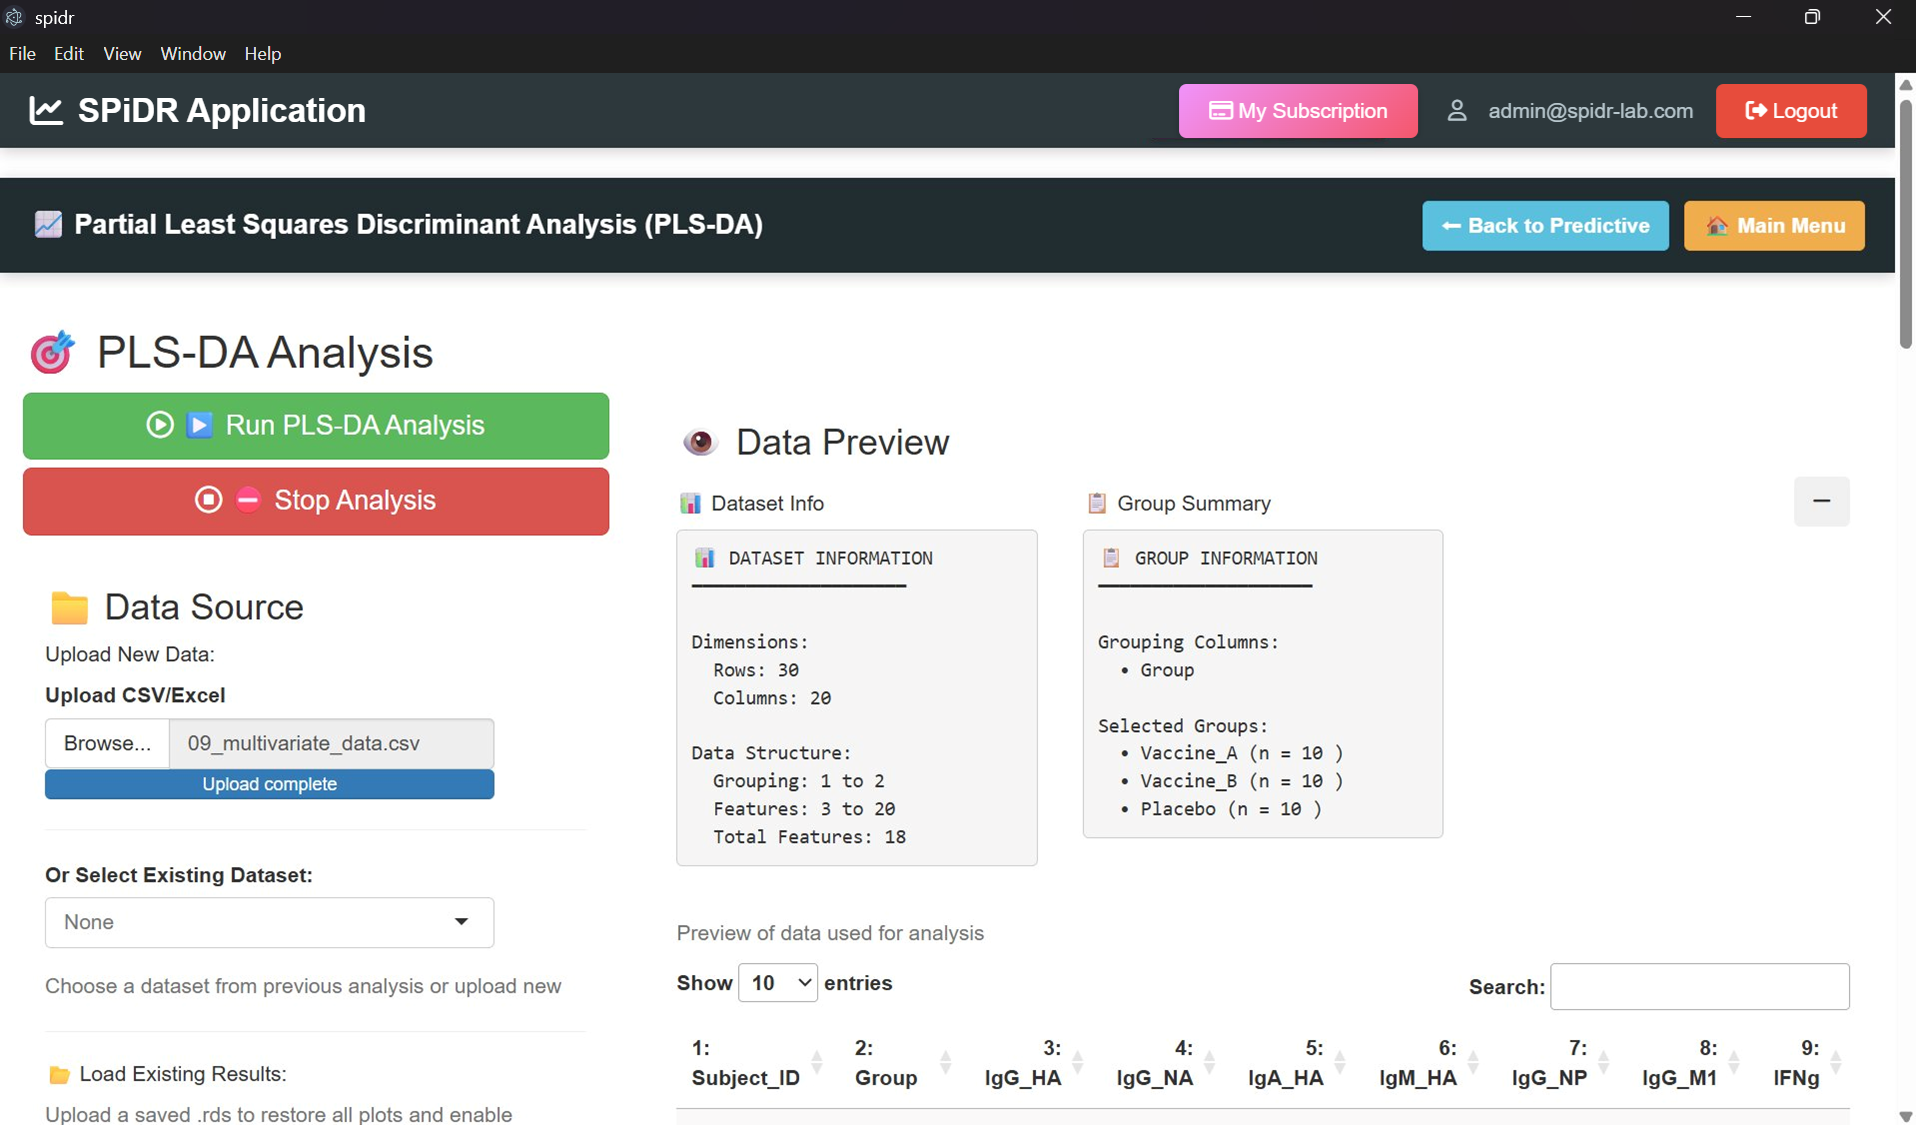
Venn · Correlation or fold-changeUnsupervised or LASSO-selected feature-supervised dimensionality reduction and classification, predicting conditional separation.
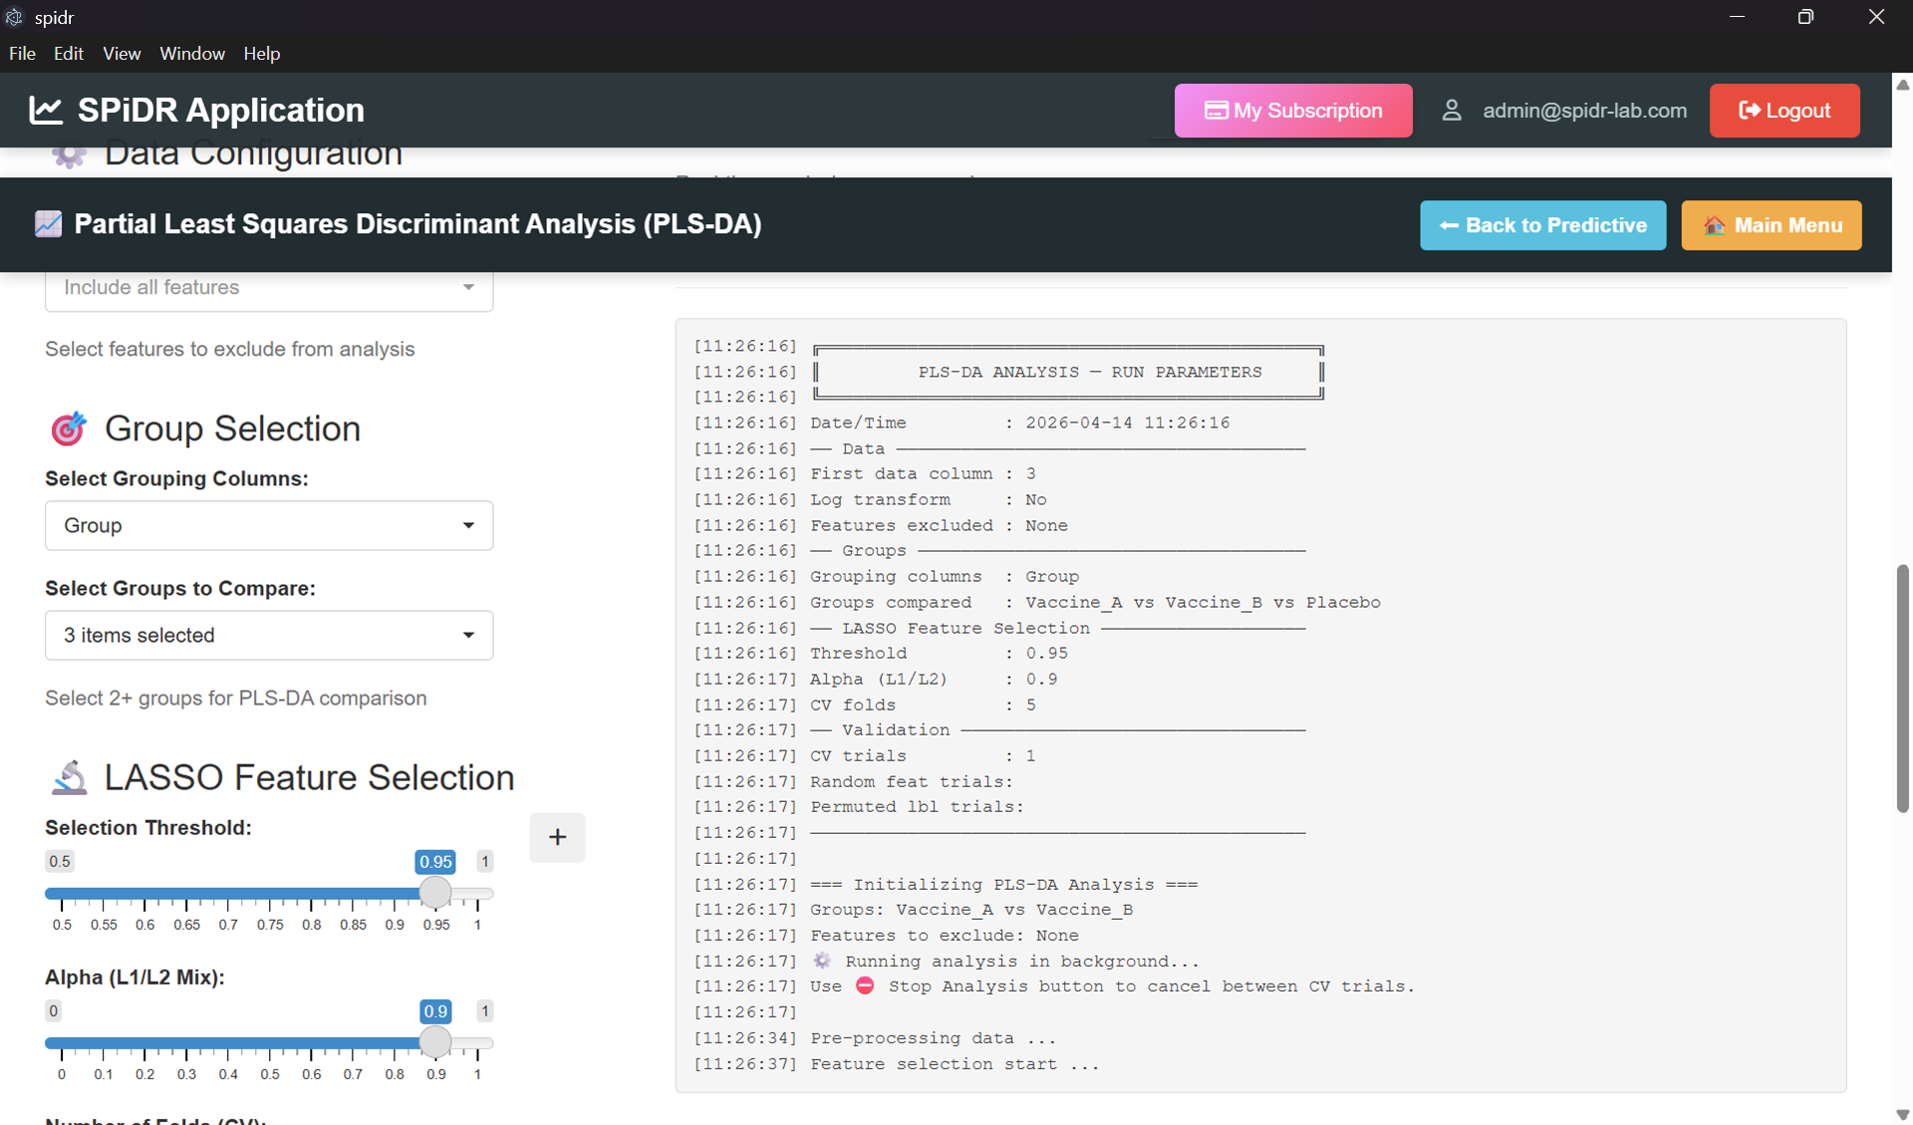
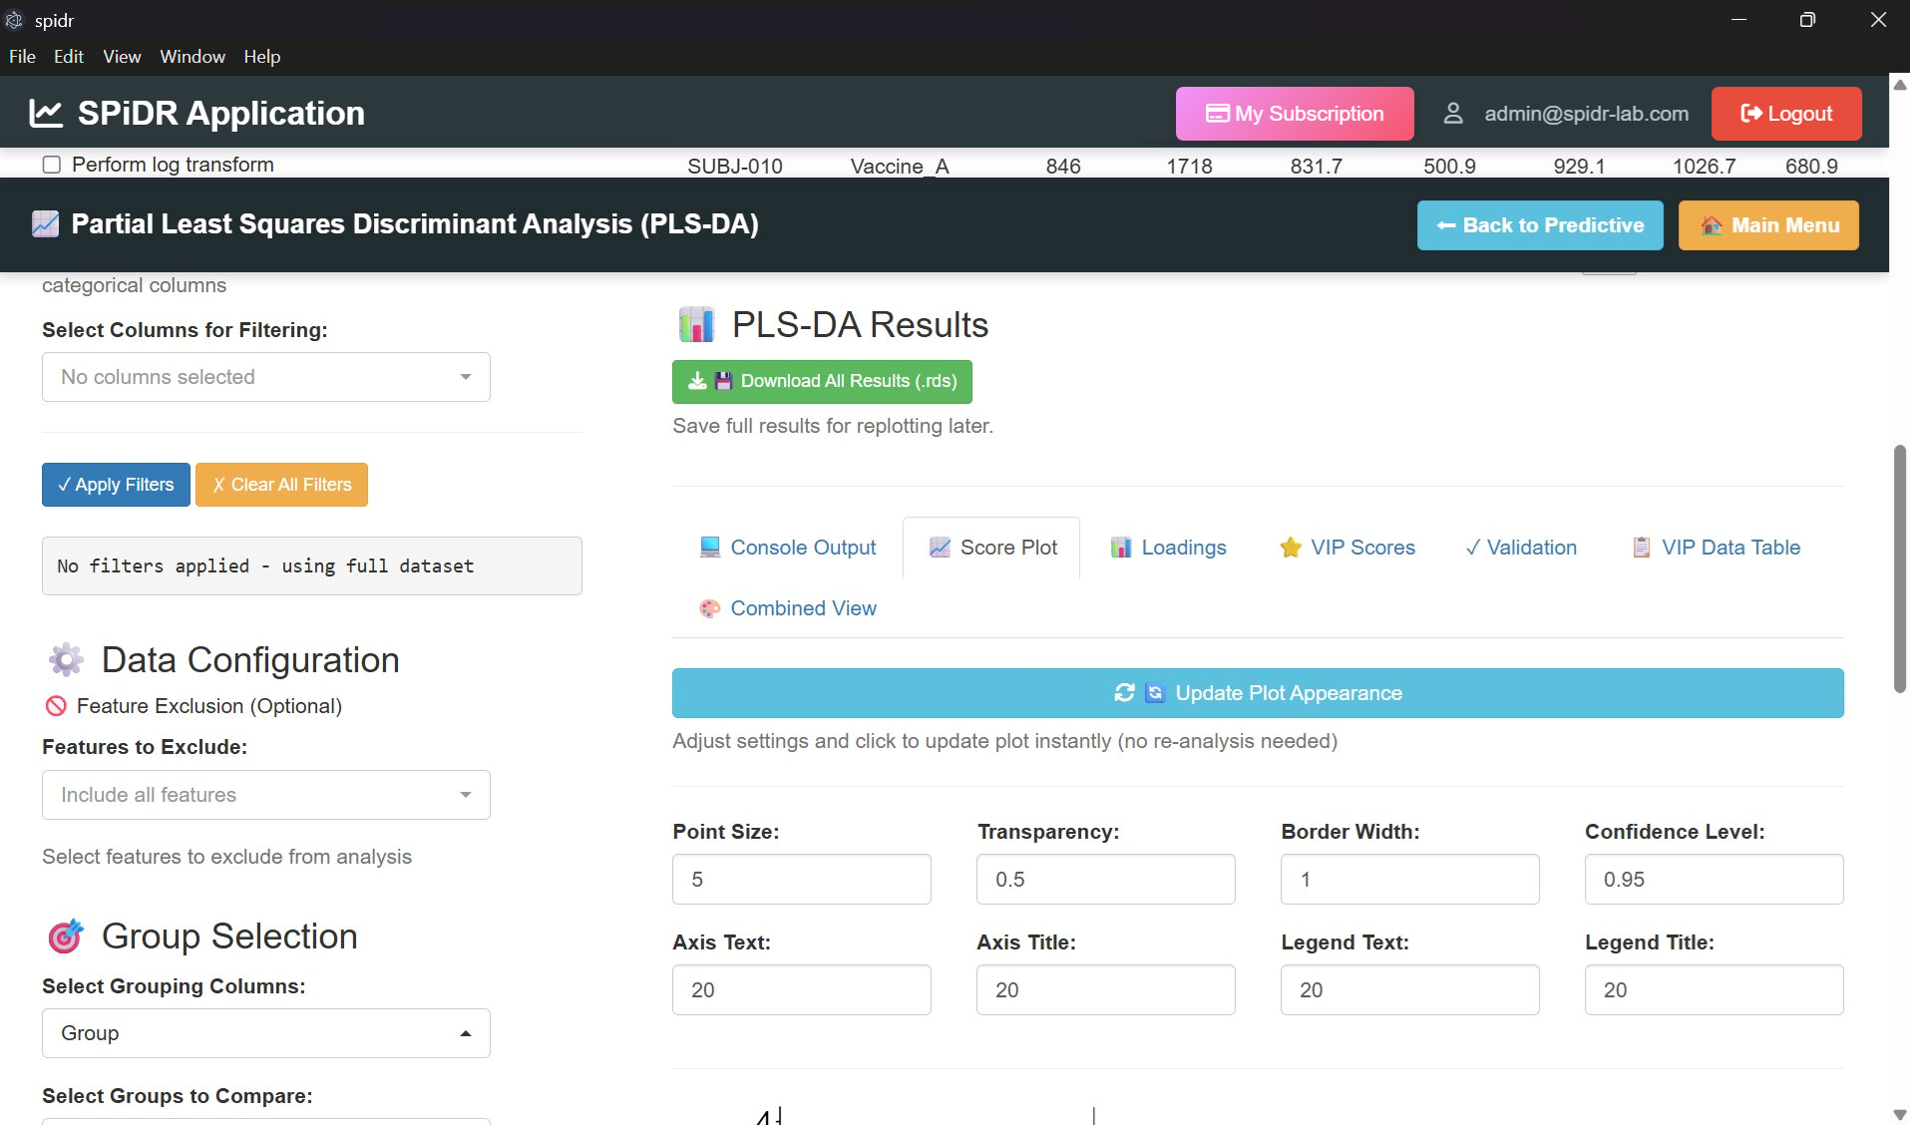
Machine learning · LASSO-PLSDA / PLSRSystematically test every combination of latent variables, LASSO threshold, and alpha to find optimal PLS-DA and PLS-R models.
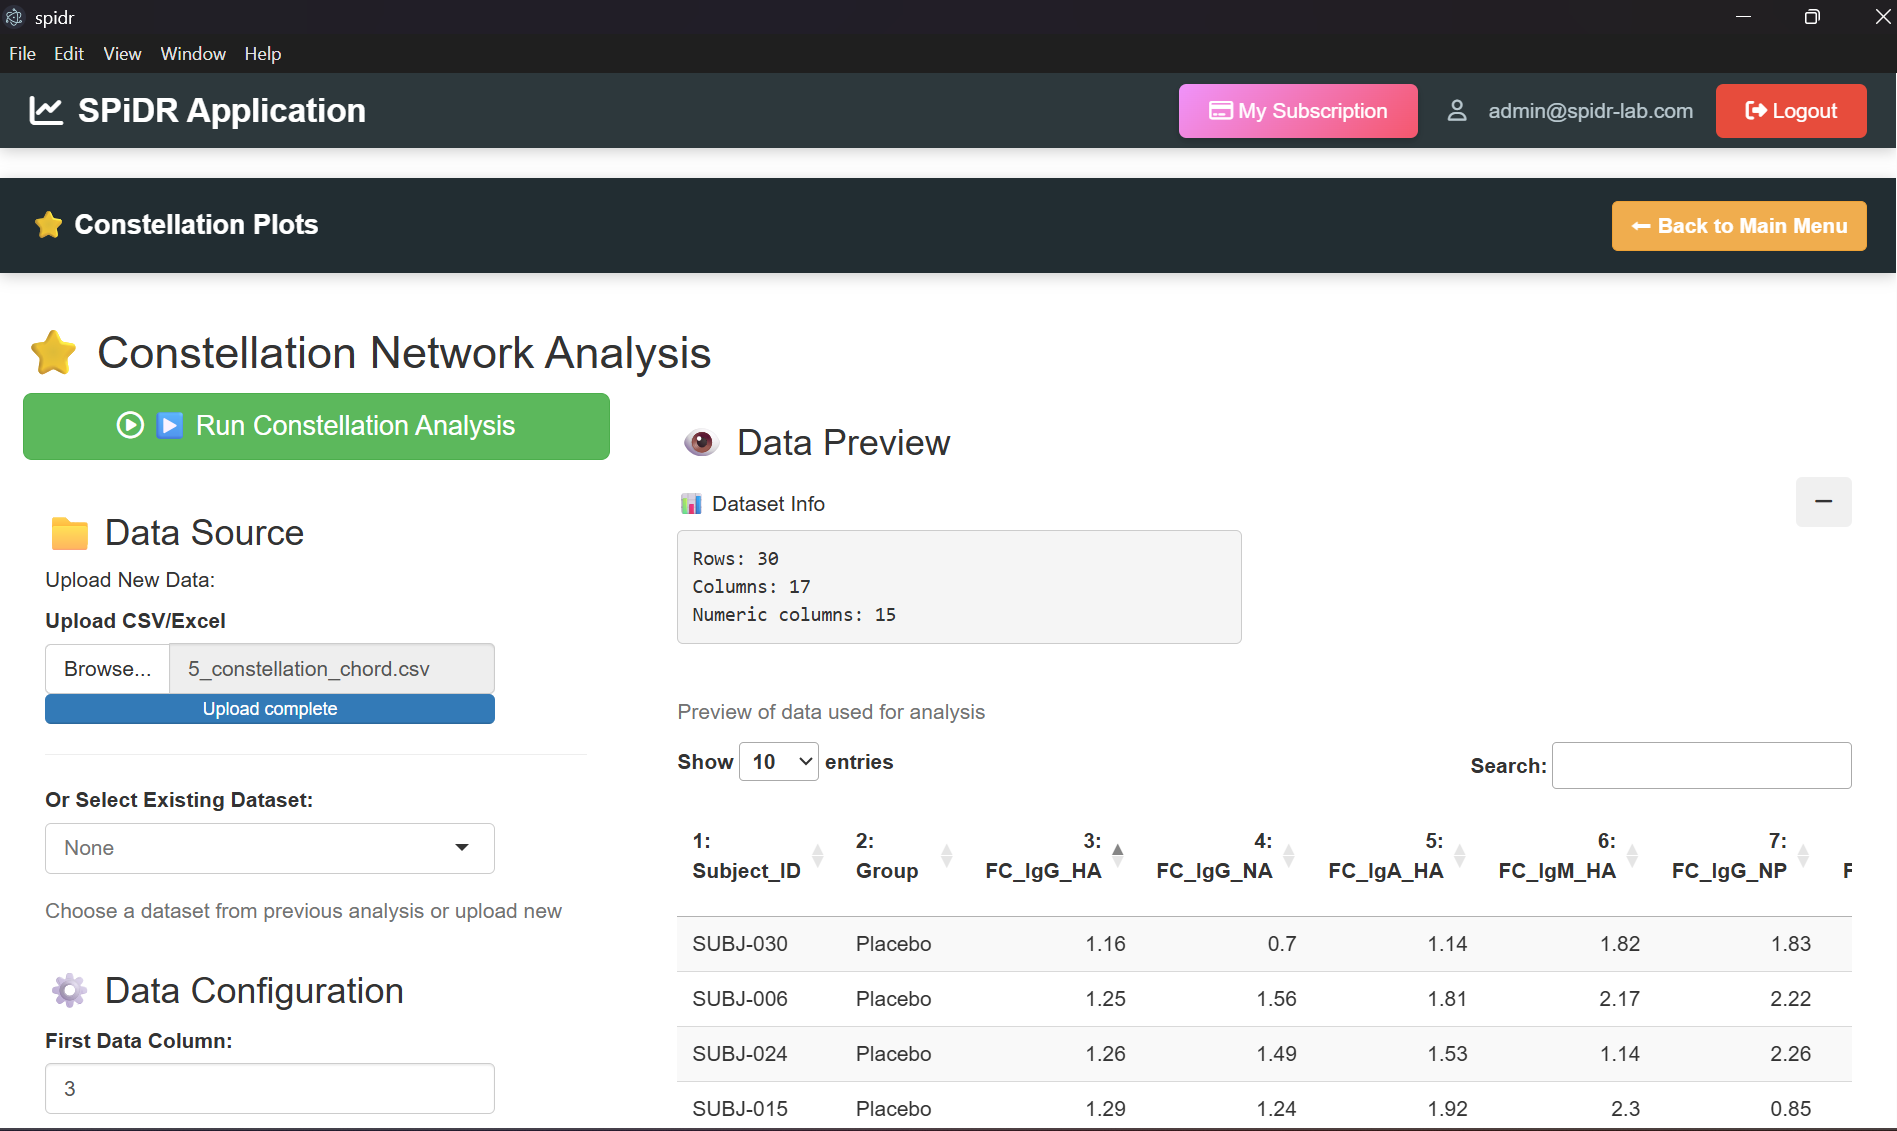
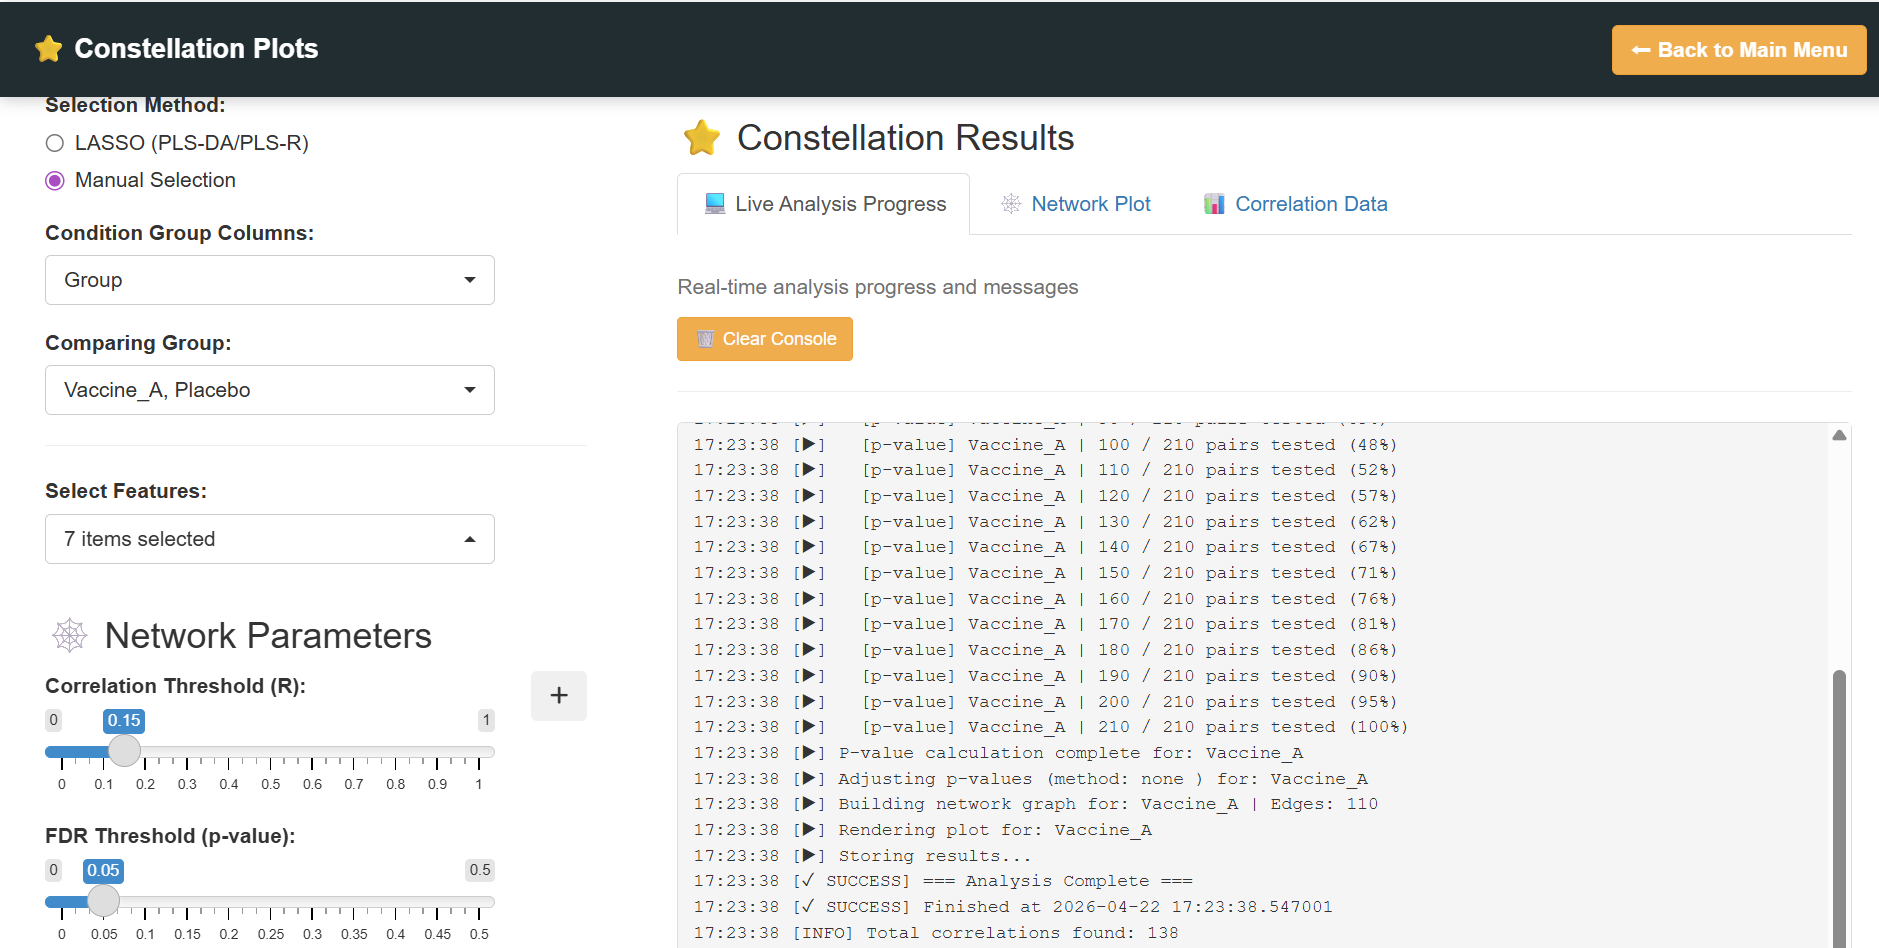
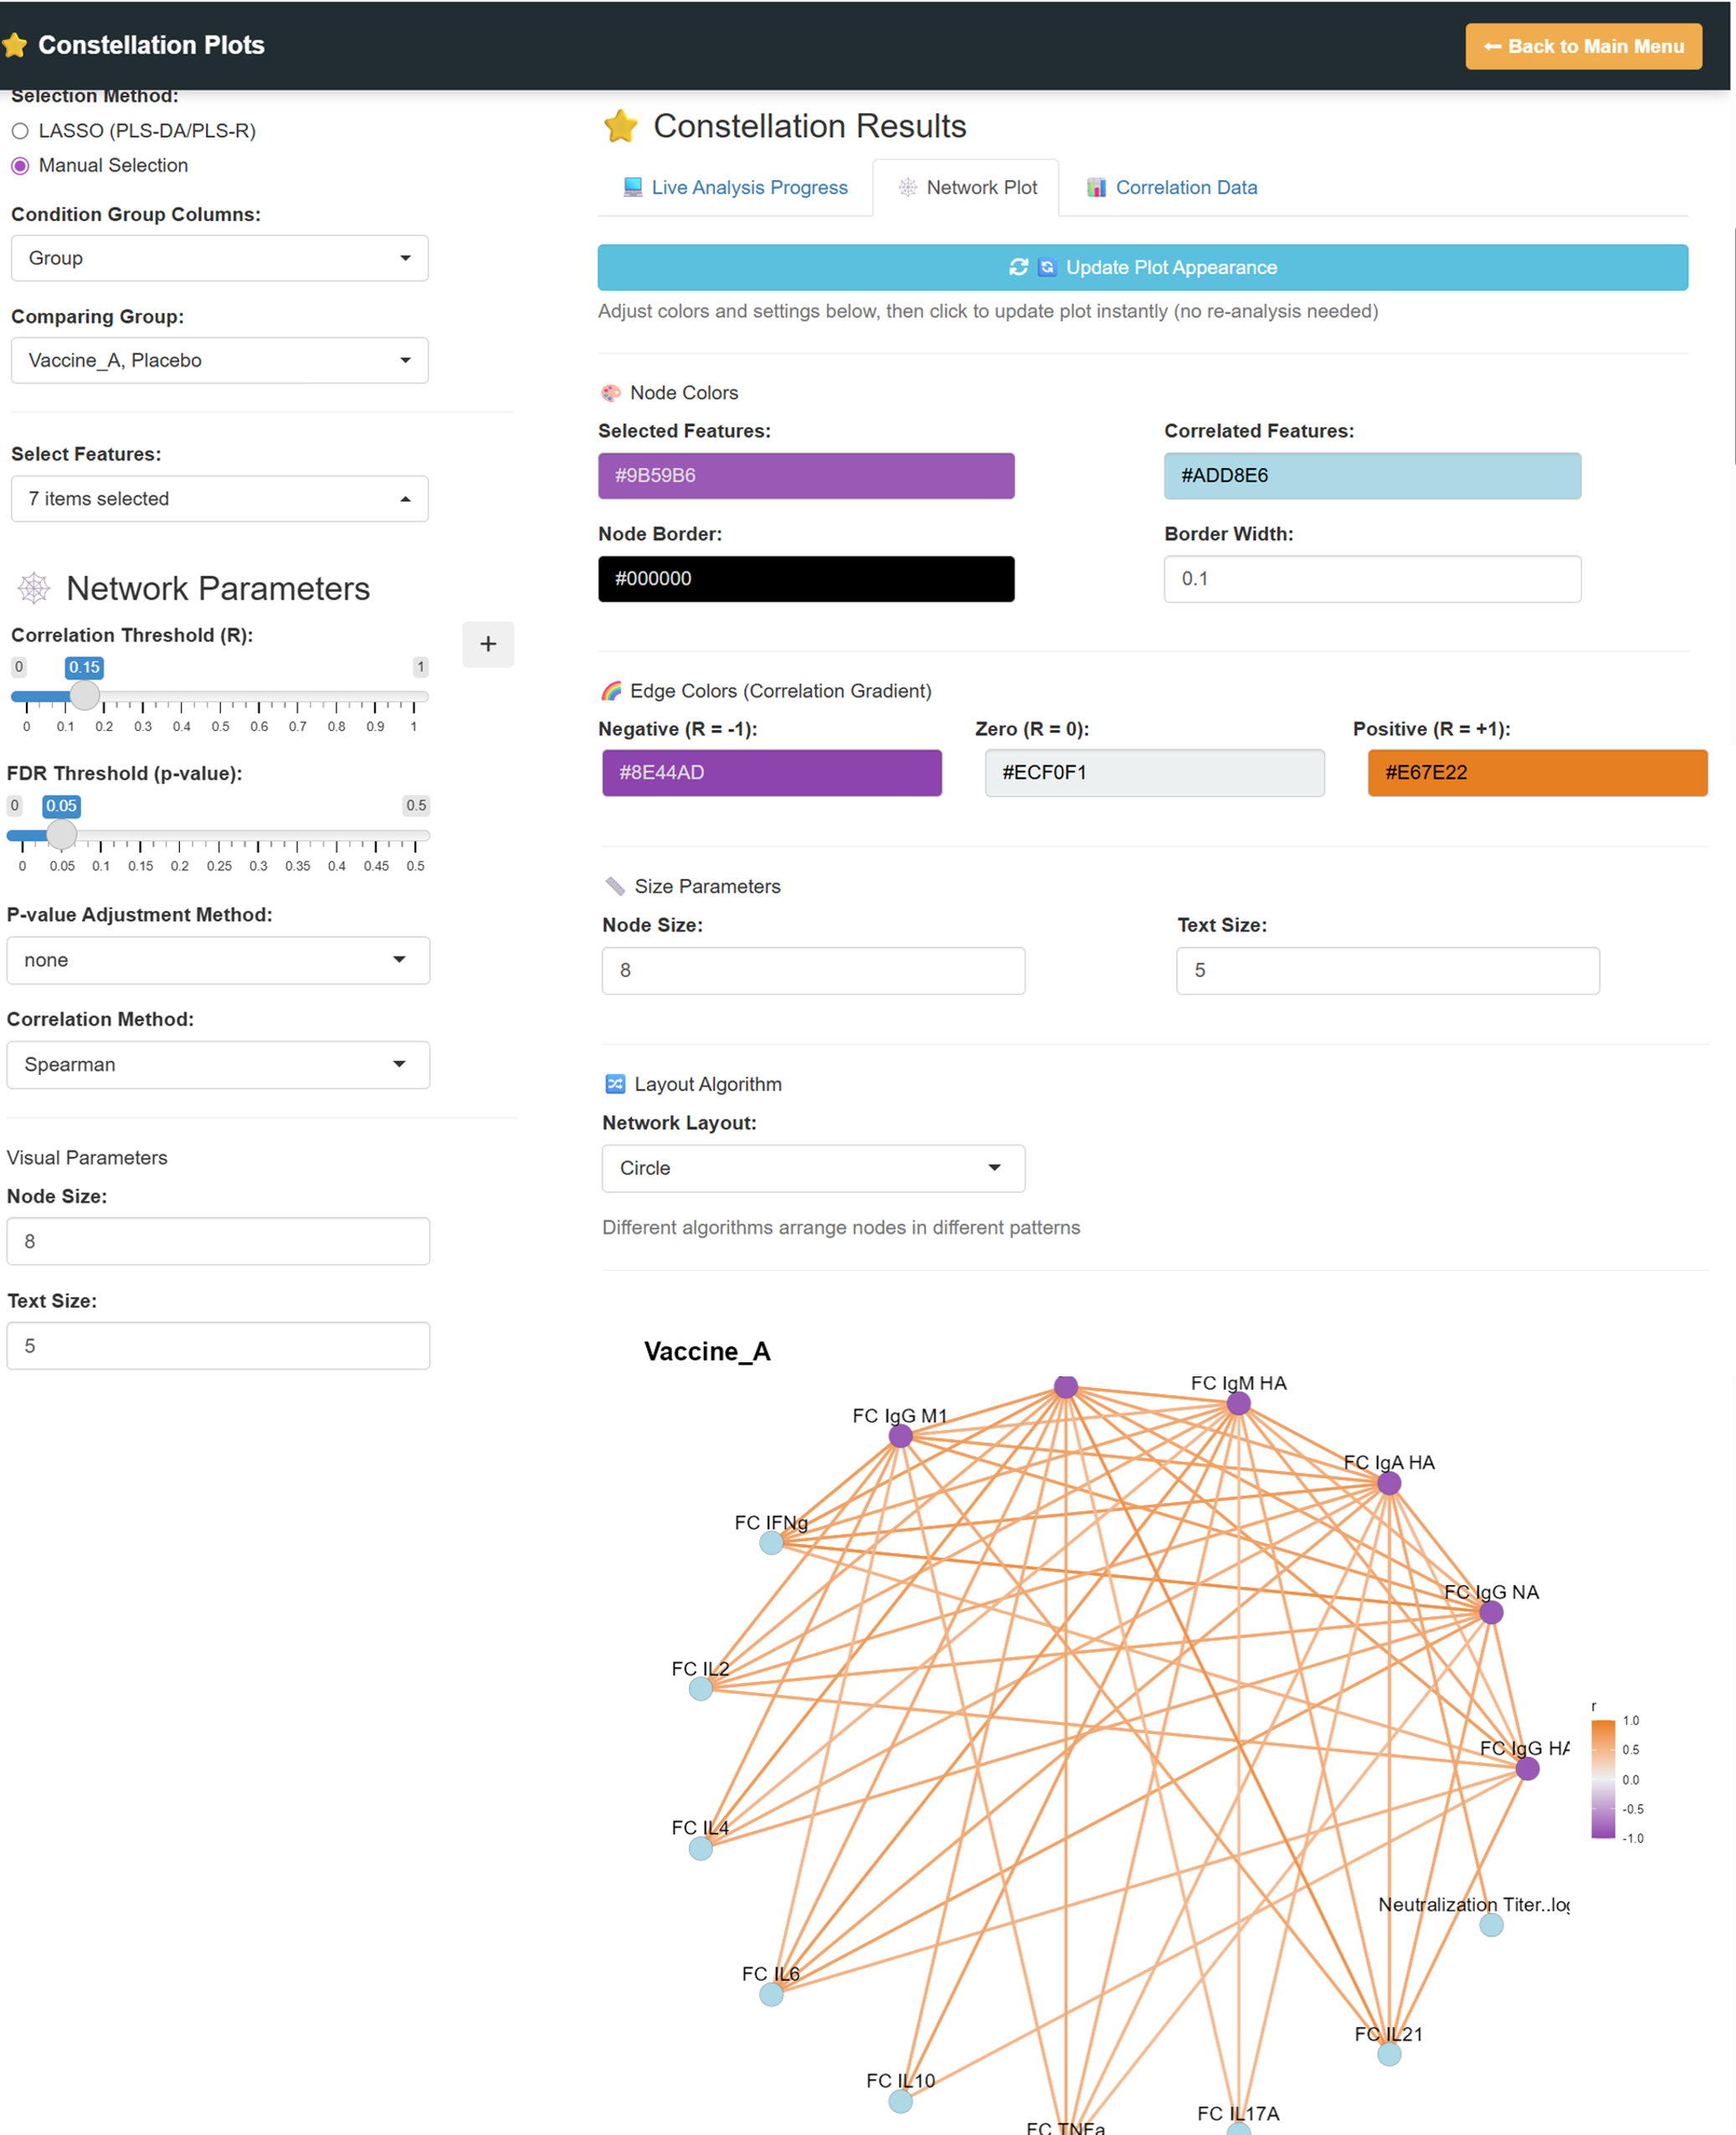
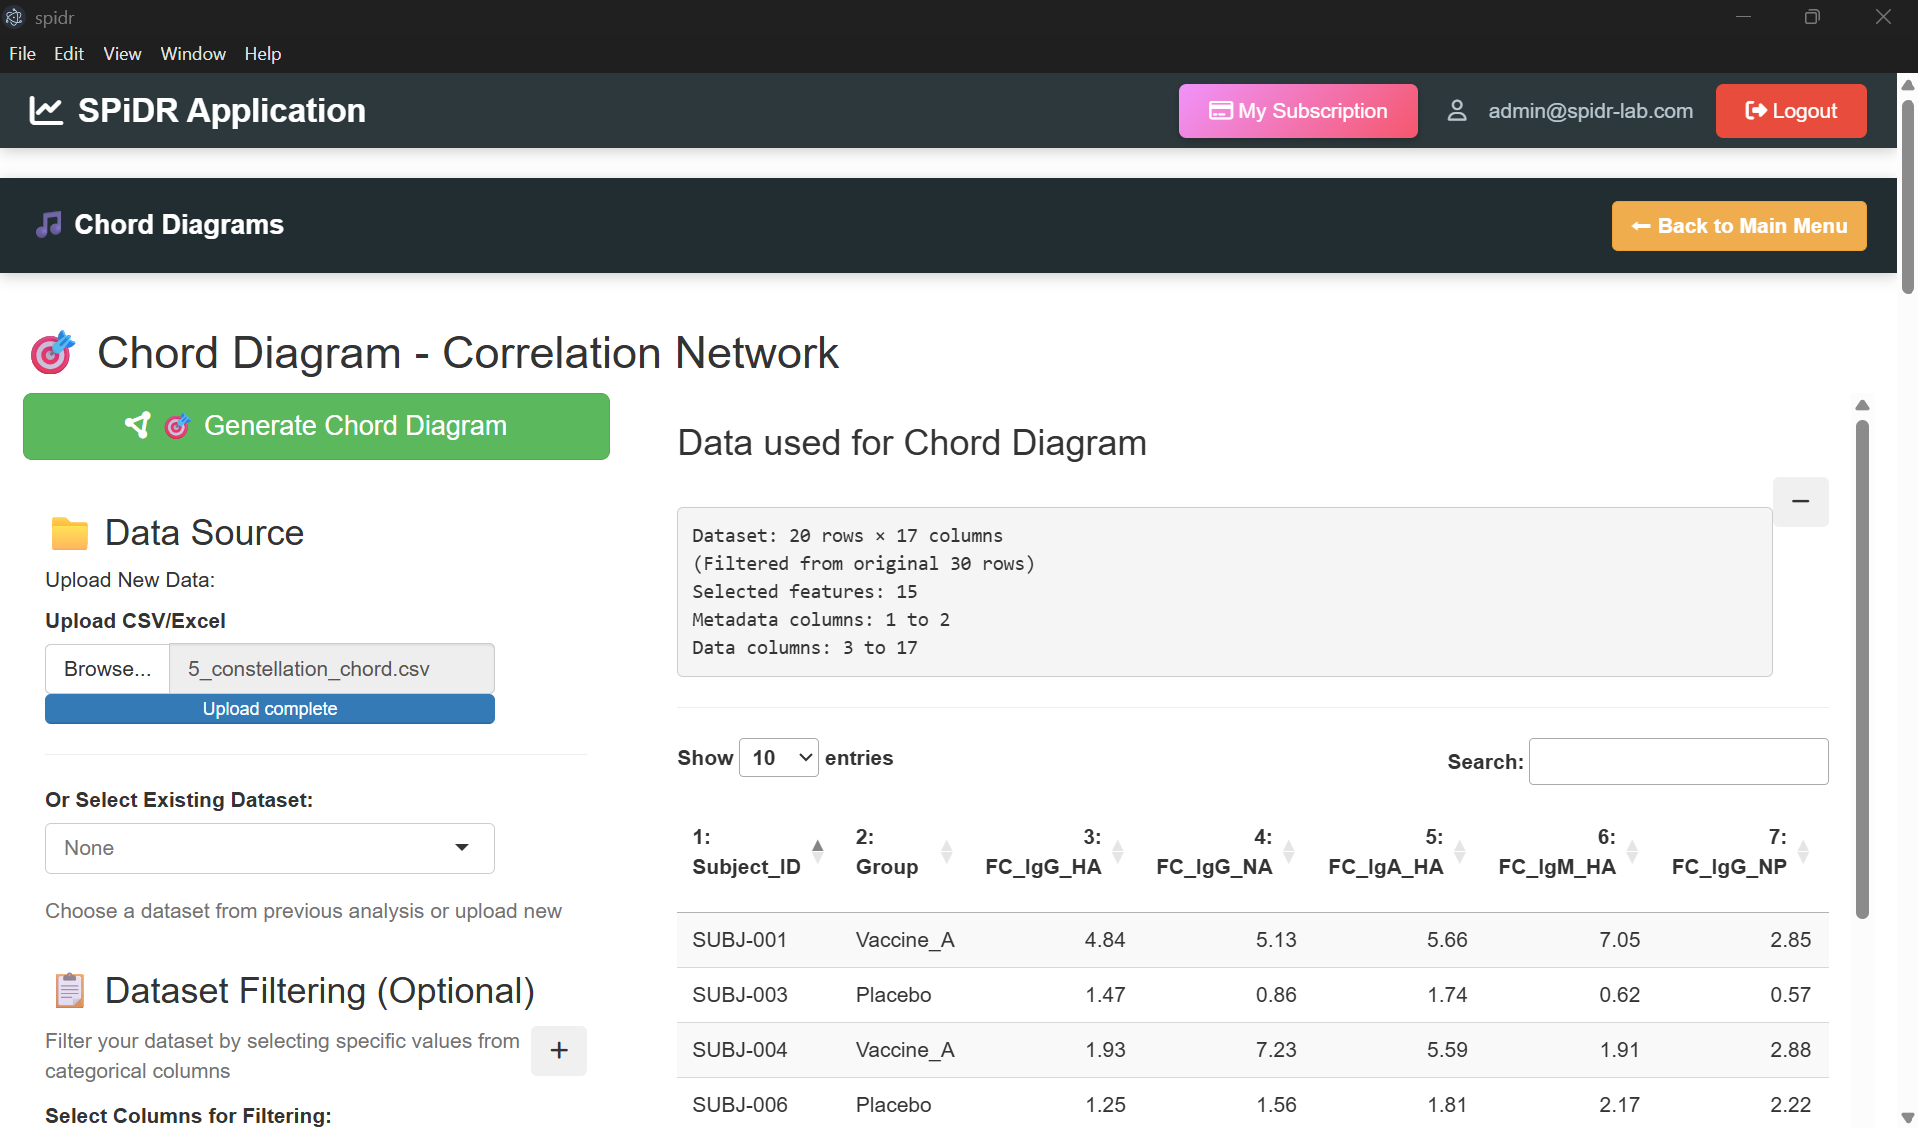
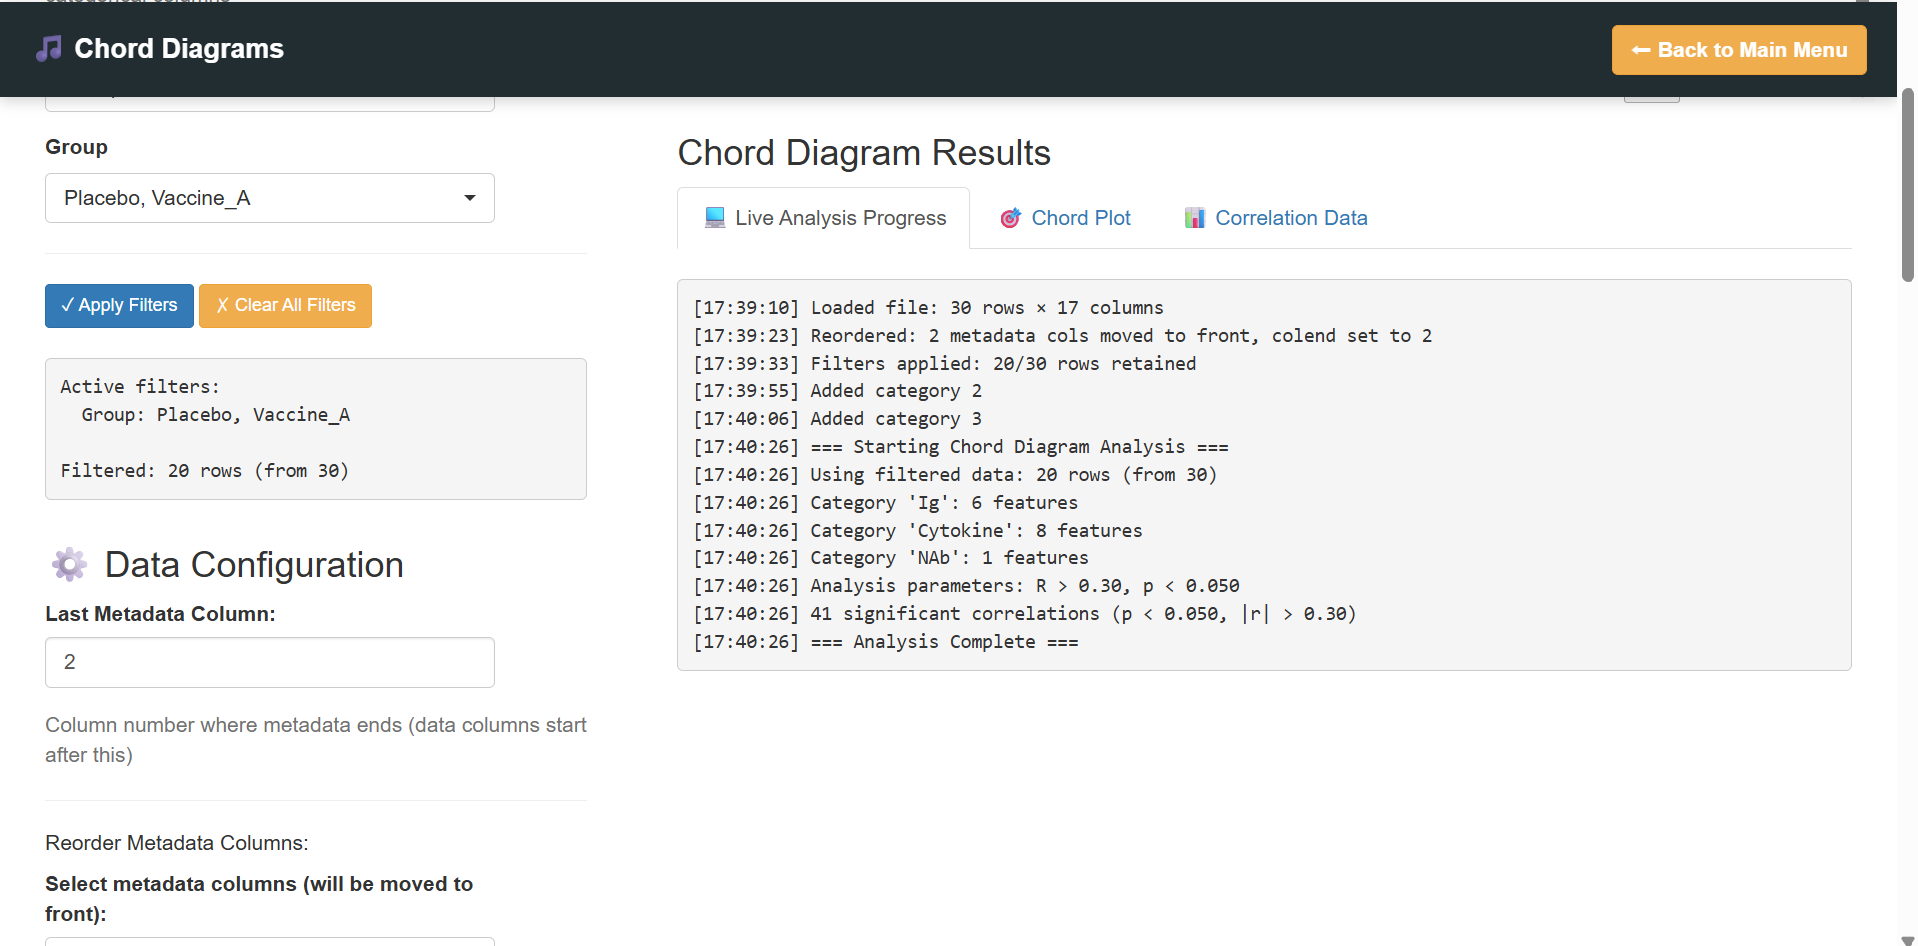
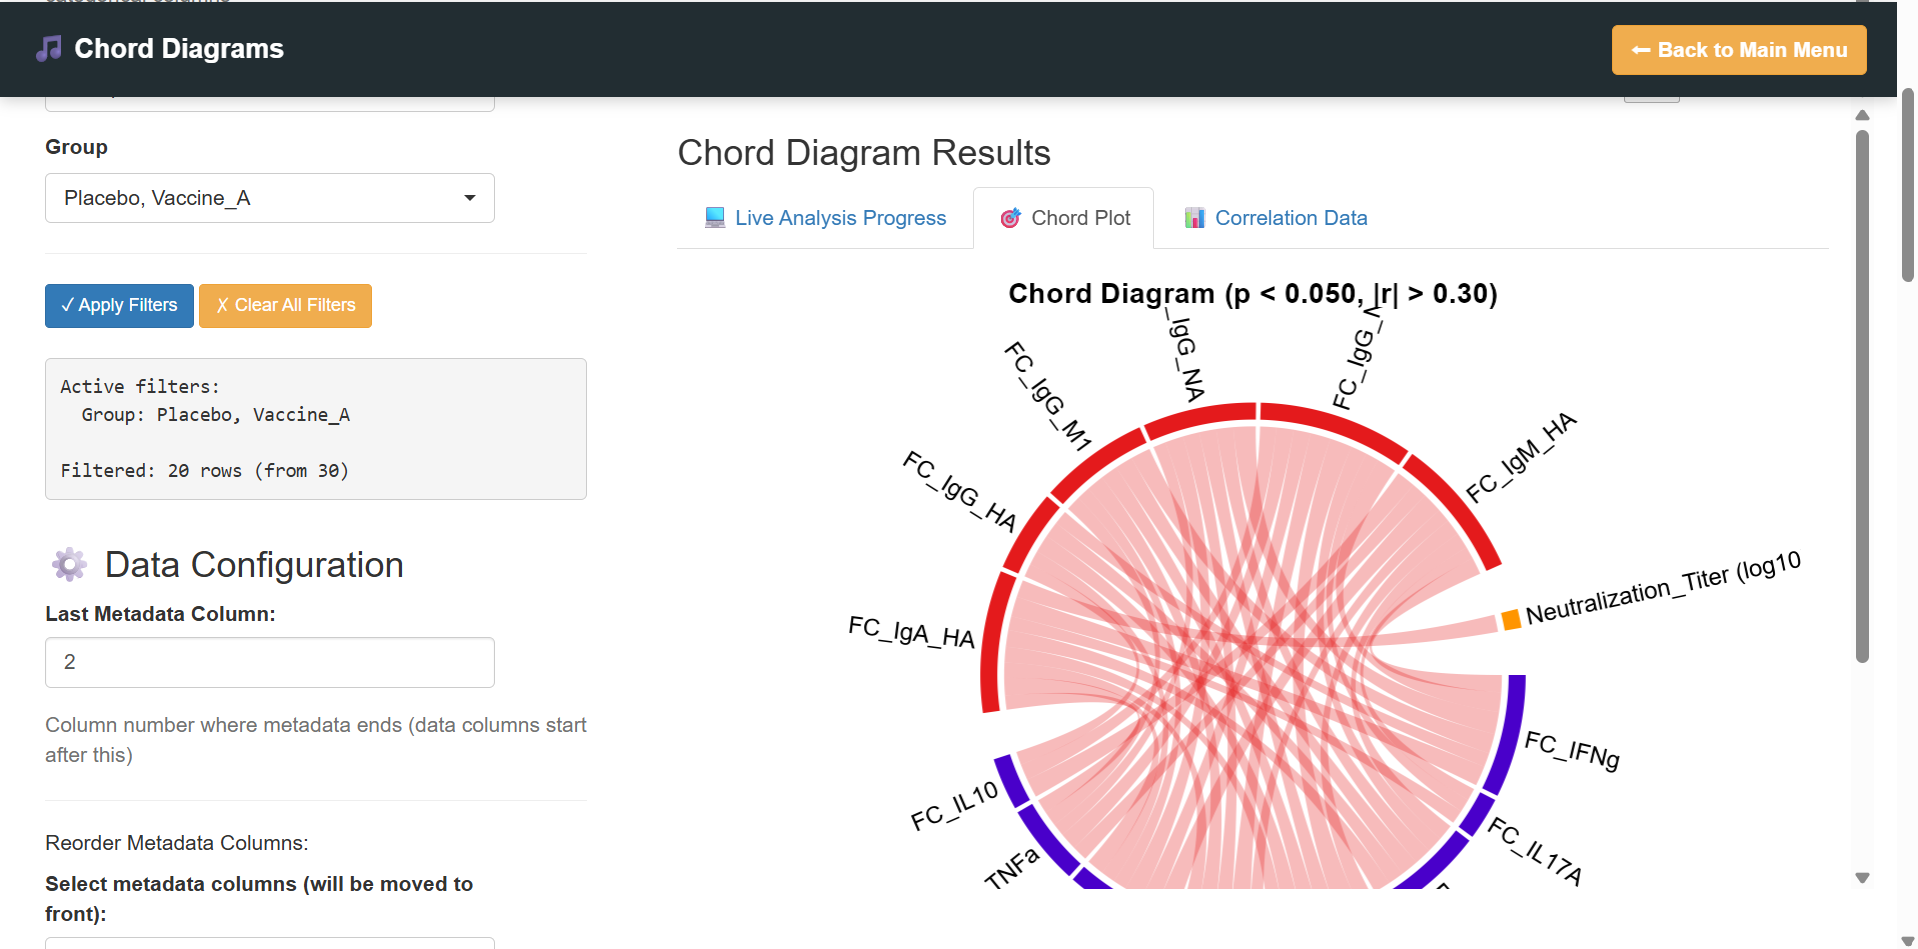
Parameter optimization for PLS-DA / PLS-RCorrelation-based network graphs with LASSO-selected or manual feature sets. Chord diagrams with user-defined category sectors and directional edge coloring.
Correlation network · Manual or LASSO-basedFour-parameter logistic (4PL) dose-response curve fitting for serum neutralization assays or PK/PD curve with automated IC/EC50 extraction.
Inhibition · 4PLRNA-seq, qRT-PCR, or plate assay differential expression feeding into ORA and GSEA pathway enrichment against MSigDB, KEGG, Reactome, and GO.
pathway analysis · Hs & Mm DatabaseEvery figure exports as PDF, PNG, or SVG at journal-quality resolution. Results tables download as Excel or CSV with full parameter logs.
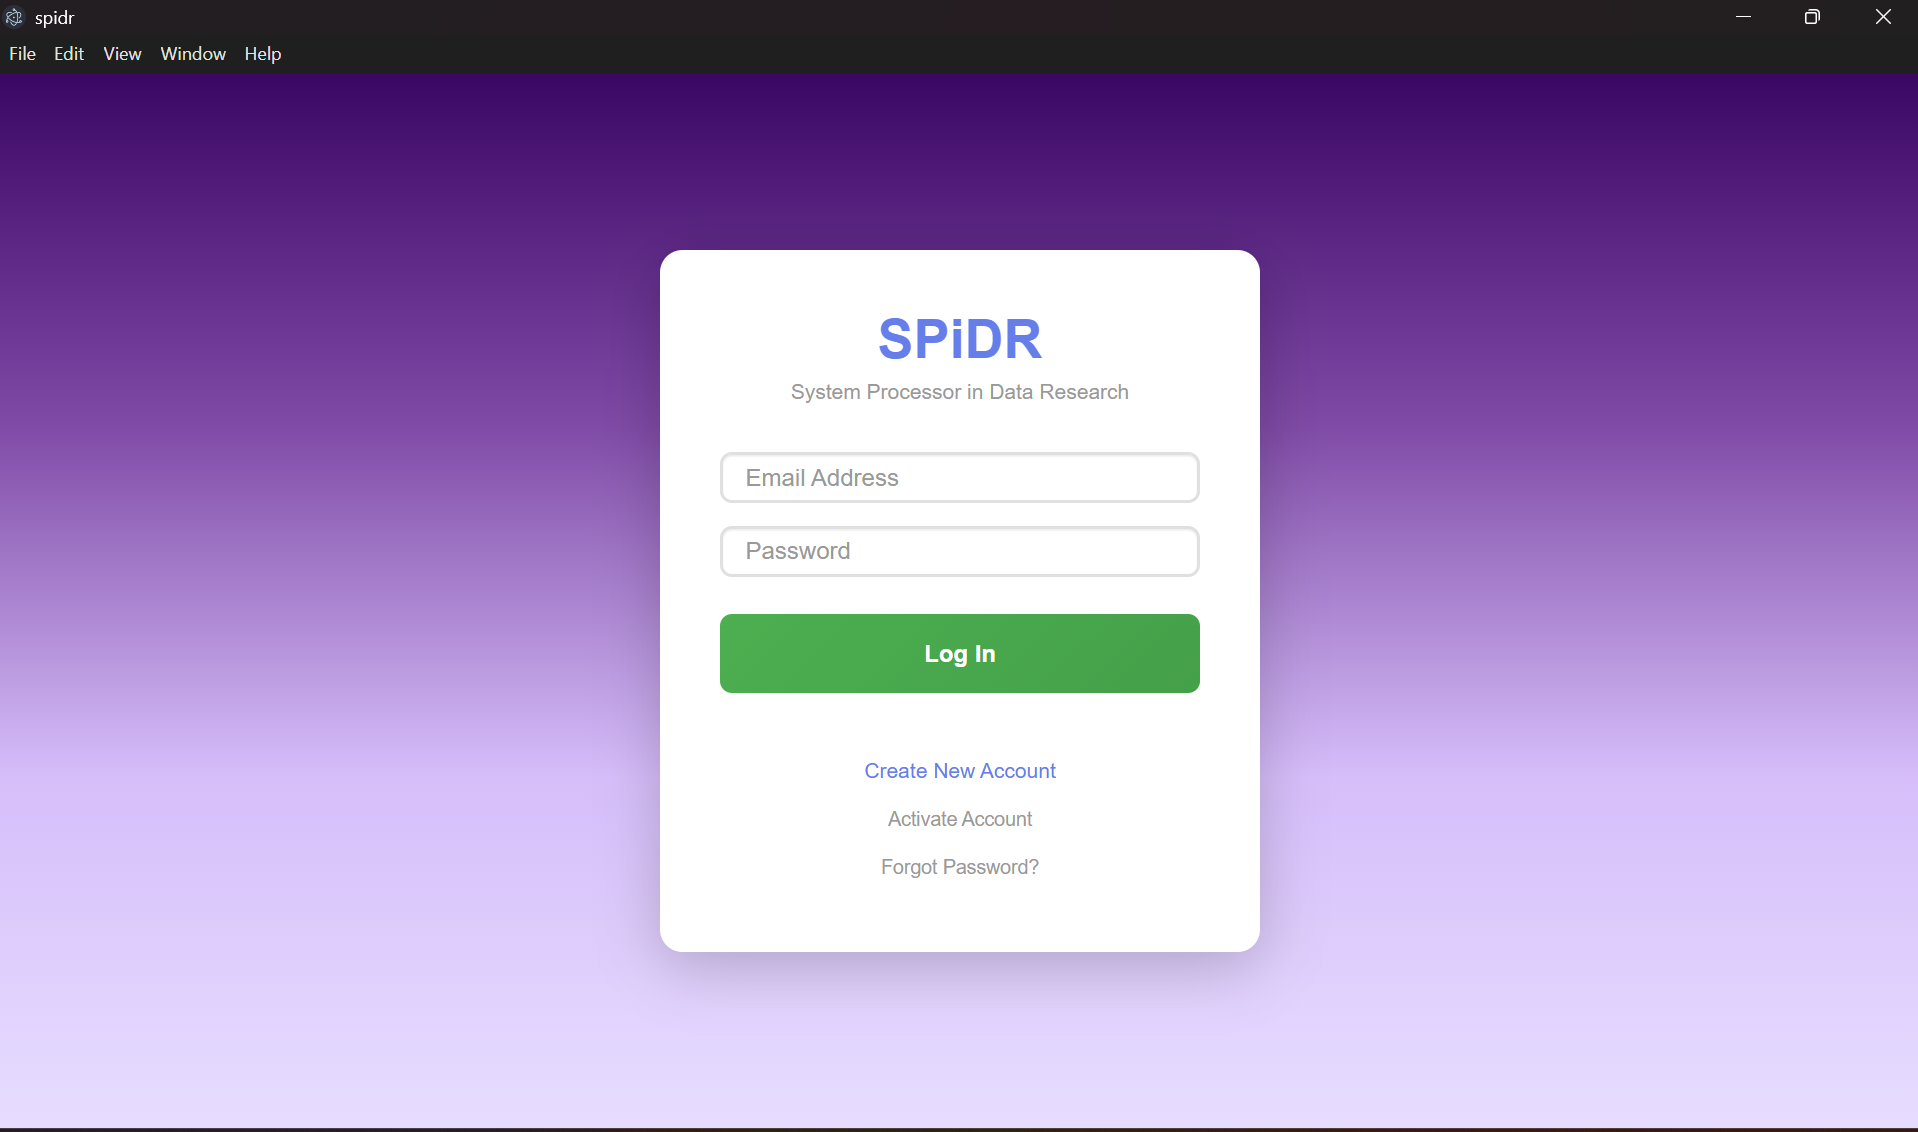
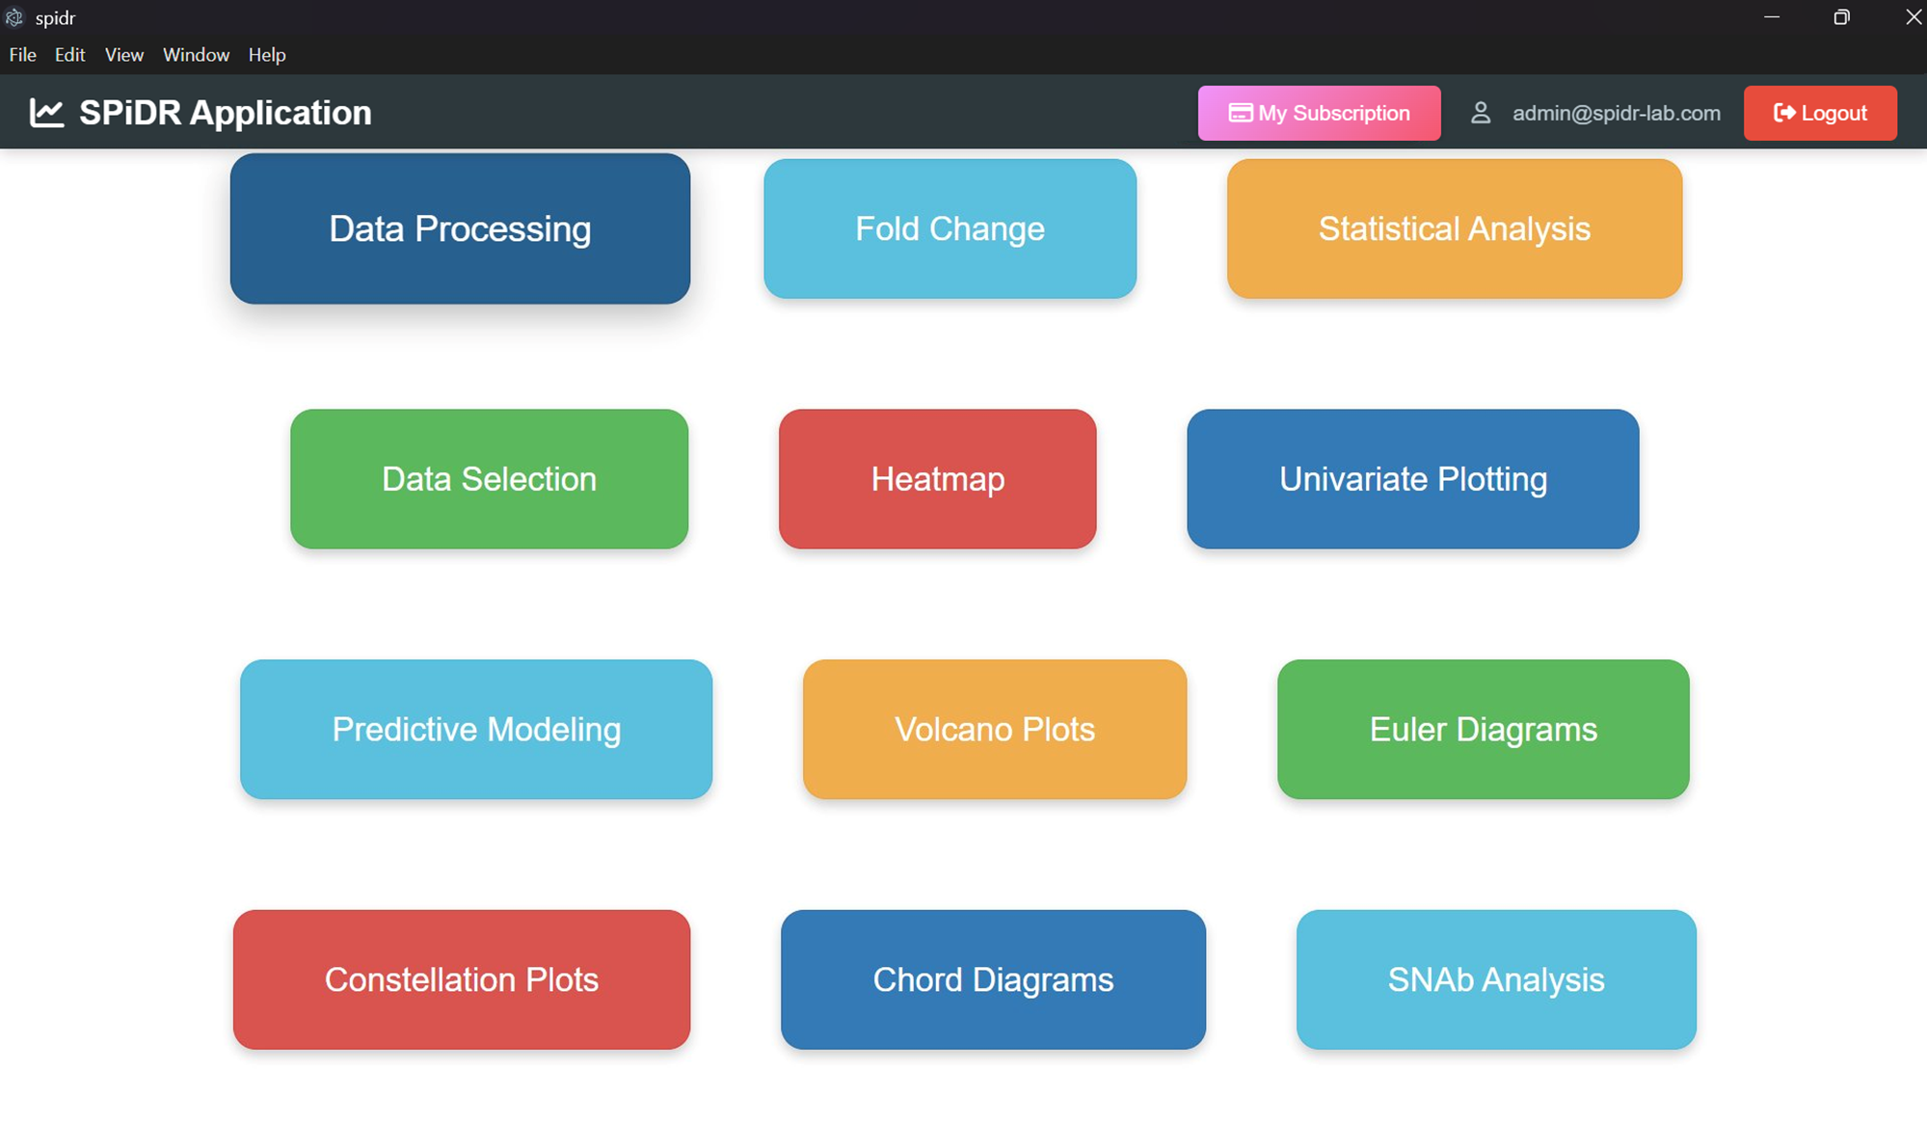
Autosave · PDF · PNG · SVGA guided, point-and-click workflow from data upload through final figure export.
Secure login, account activation, and a color-coded main menu with one-click access to all modules.
Upload, merge, and clean datasets. Compute fold change and run statistical tests across all analytes.
Univariate plots with significance brackets, heatmaps, volcano plots, and Euler diagrams.
PCA, PLS-DA, PLS-R with integrated LASSO feature selection and automated sweep optimization.

Correlation network visualized via constellation network or chord connections.